Fig. 11.
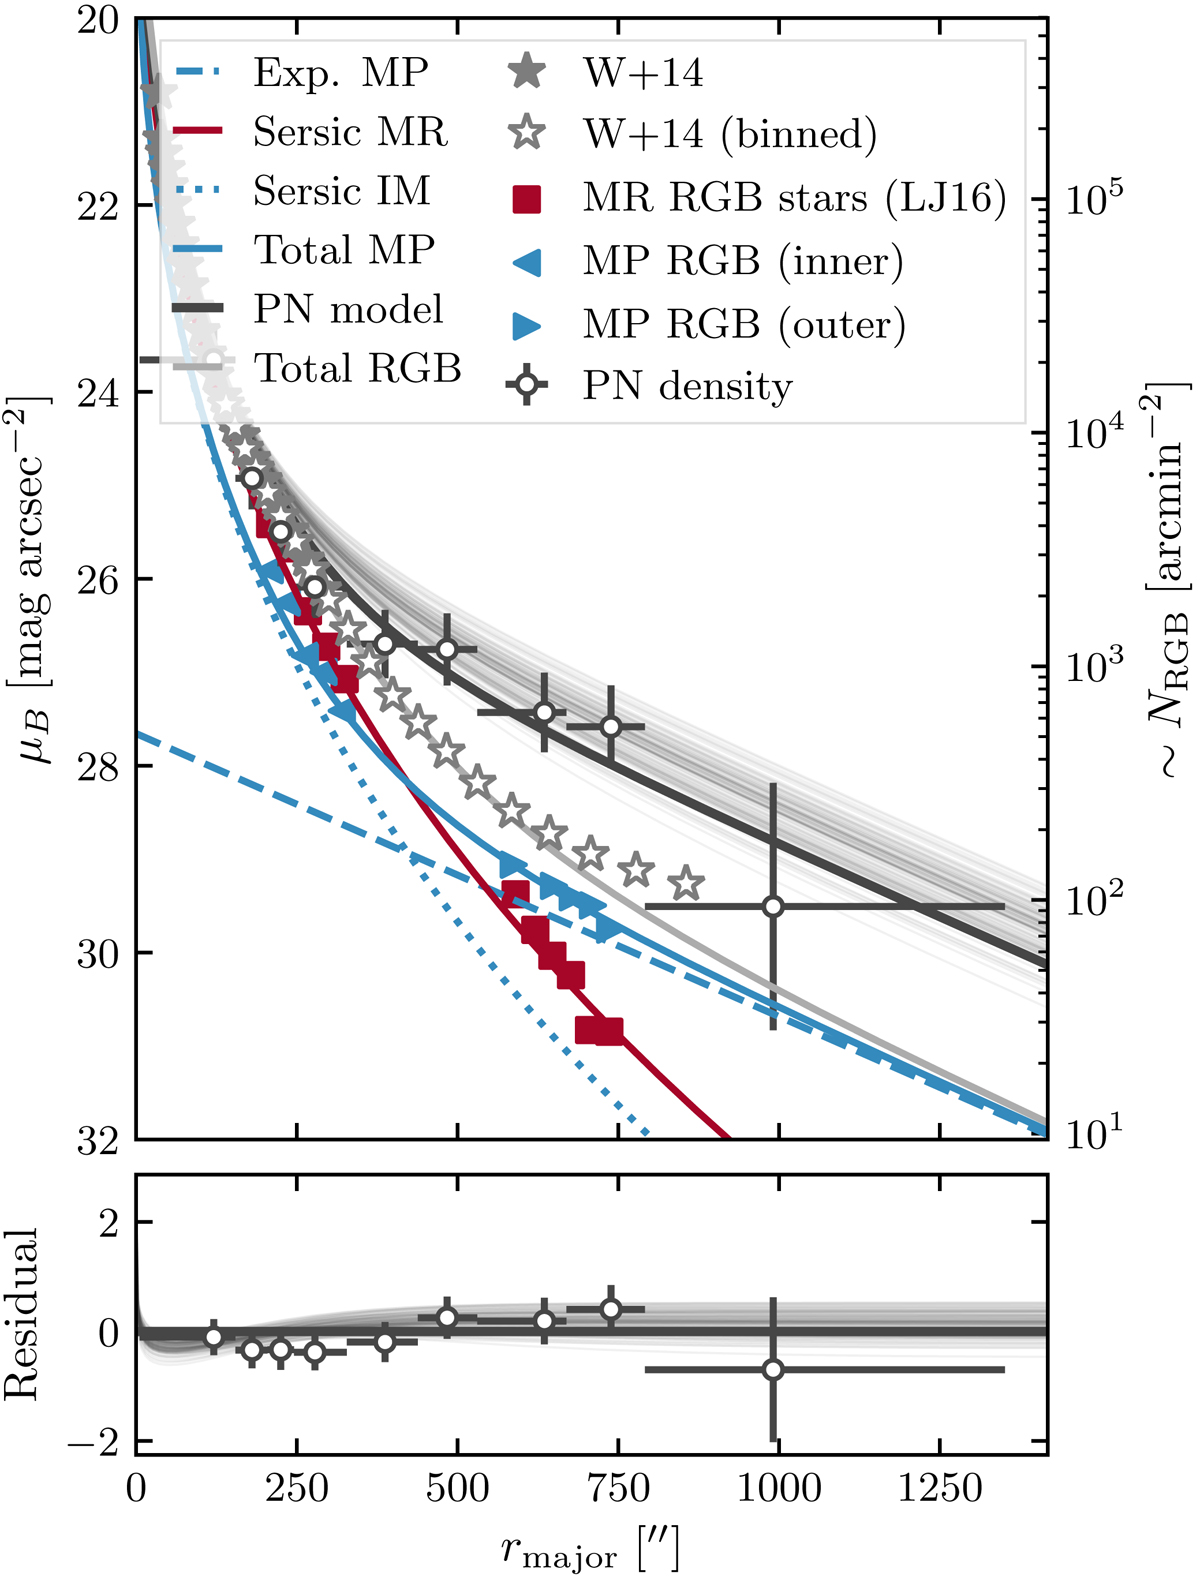
Final stellar population decomposition of the integrated SB and PN number density profiles. Top panel: final best-fit model (black line) to the PN number density (black crosses). Comparison of the integrated B-band SB profiles (grey stars; open symbols denote binned data Watkins et al. 2014) with resolved stellar population studies of RGB stars (Lee & Jang 2016): blue triangles indicate MP stars, and red squares show MR stars. We used a metallicity-weighted conversion factor from RGB number densities to SB (see Sect. 5.1). The right y axis is thus only an indication of the RGB number density. The RGB number density profile is decomposed into an exponential MP profile (dashed blue line), an intermediate-metallicity (IM) Sérsic profile (dotted blue line), and the MR Sérsic (solid red line). The many thin grey lines are indicative of error ranges and were determined using Monte Carlo techniques (cf. Appendix B). Lower panel: residuals of the best fit.
Current usage metrics show cumulative count of Article Views (full-text article views including HTML views, PDF and ePub downloads, according to the available data) and Abstracts Views on Vision4Press platform.
Data correspond to usage on the plateform after 2015. The current usage metrics is available 48-96 hours after online publication and is updated daily on week days.
Initial download of the metrics may take a while.