Fig. 10.
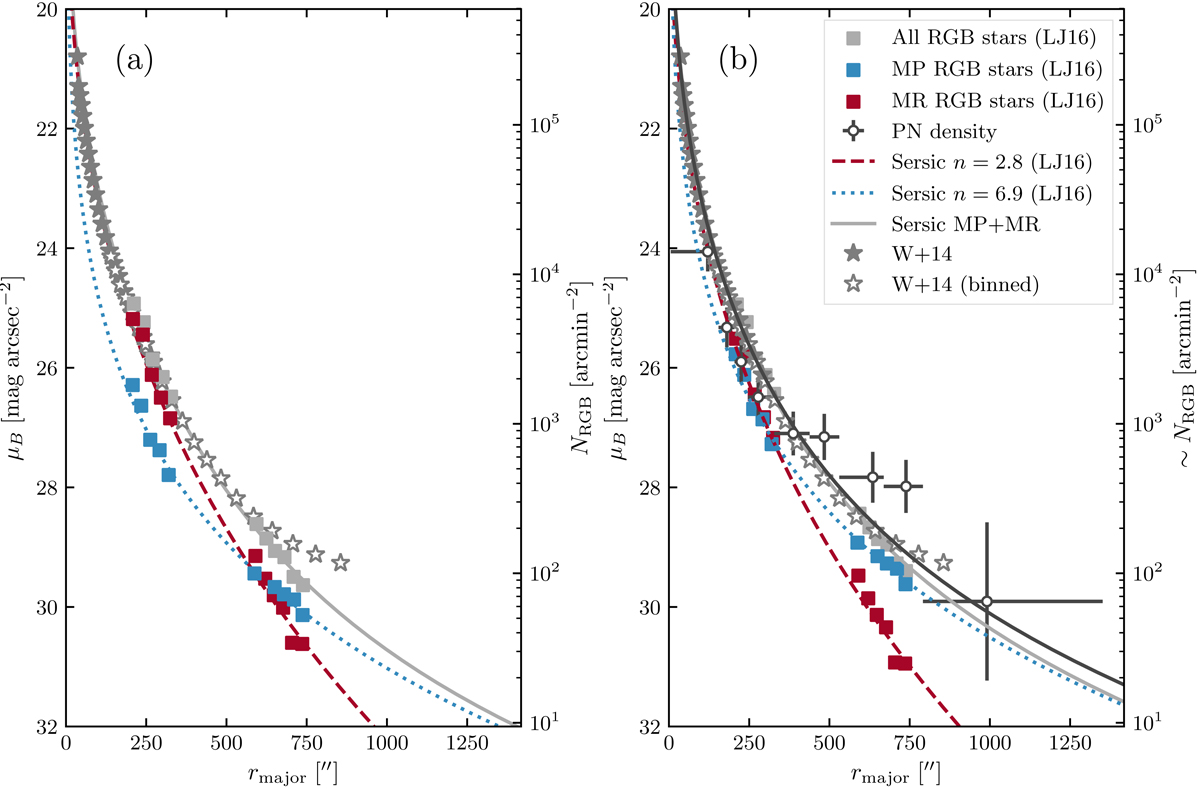
a: comparison of the integrated B-band SB profiles (grey stars; open symbols denote binned data Watkins et al. 2014) with resolved stellar population studies of RGB stars (Lee & Jang 2016): grey squares indicate the number densities of all RGB stars, blue squares MP ([M/H] < 0.7) stars and red squares MR ([M/H] ≥ 0.7) stars. The coloured lines denote the best-fit Sérsic profiles to the respective stellar population determined by Lee & Jang (2016) with the best-fit indices stated in the legend of panel b. The RGB number densities were converted into SB using a constant conversion factor. b: same as panel a, but with a metallicity-weighted conversion factor from RGB number densities to SB (see Sect. 5.1) The right y-axis is only an indication of the RGB number density, as the conversion from μB is metallicity dependent. In addition, we also show the PN number density (black crosses). The solid black line represents the modelled PN number density profile, where the model consists of the MP and MR Sérsic profiles weighted by the respective α-parameter values.
Current usage metrics show cumulative count of Article Views (full-text article views including HTML views, PDF and ePub downloads, according to the available data) and Abstracts Views on Vision4Press platform.
Data correspond to usage on the plateform after 2015. The current usage metrics is available 48-96 hours after online publication and is updated daily on week days.
Initial download of the metrics may take a while.