Fig. 1.
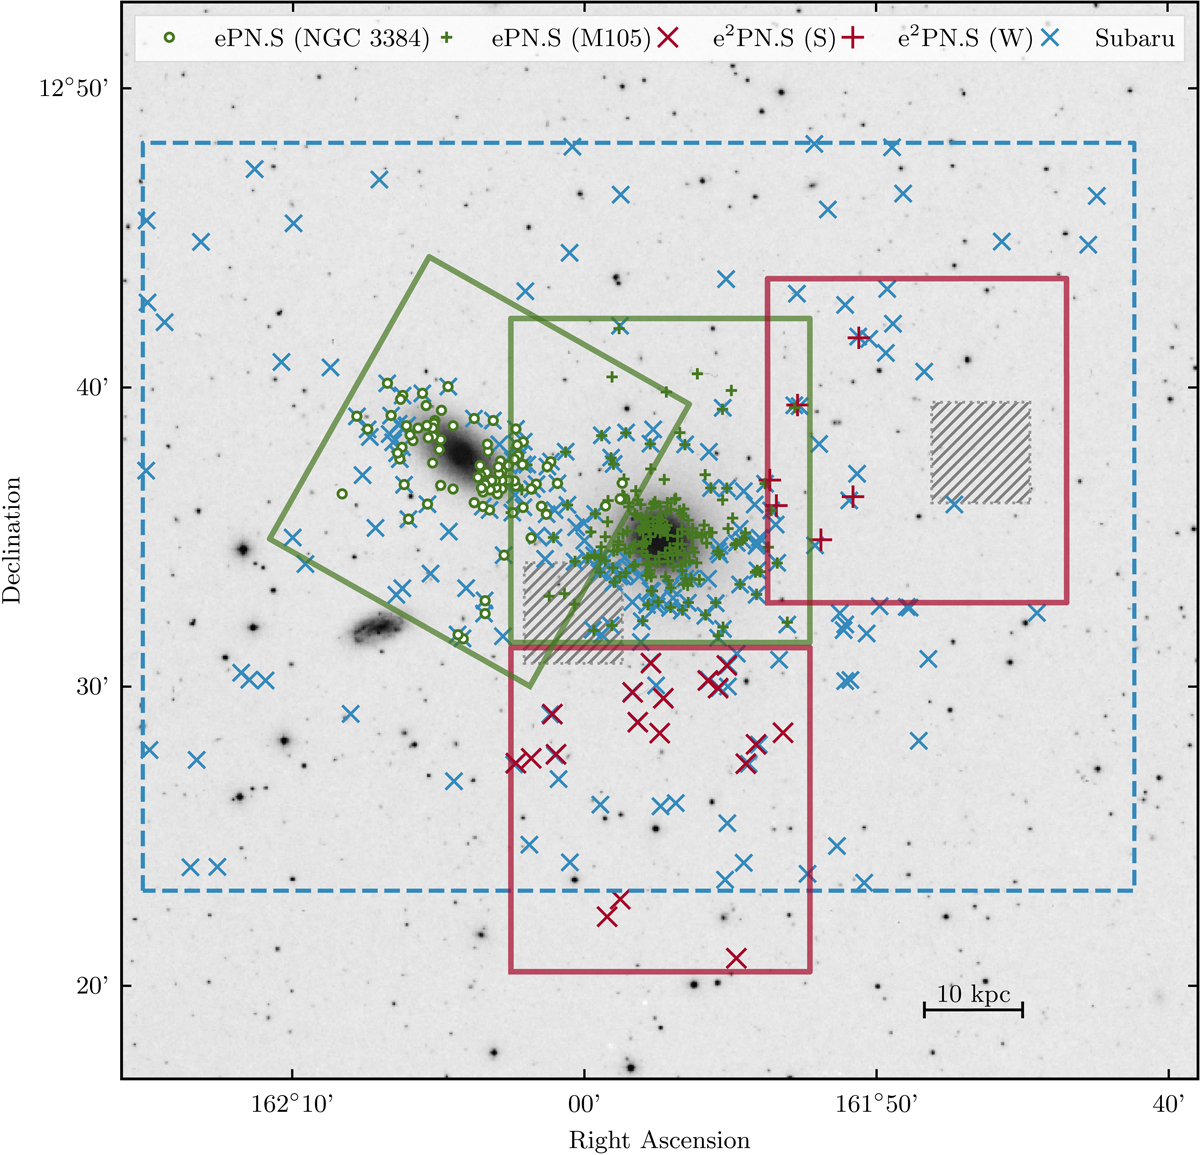
DSS image of M 105. Overplotted are the PN candidates from the Subaru survey (blue crosses), PNe from the ePN.S survey (Pulsoni et al. 2018, green pluses), and the e2PN.S survey (this work, red pluses and crosses). PNe in NGC 3384 from Cortesi et al. (2013a) are denoted with green circles. The red and green rectangles denote the ePN.S and e2PN.S fields, and the dashed blue rectangle indicates the SuprimeCam footprint. The grey hatched regions indicate the two HST fields analysed in Lee & Jang (2016). The scale bar in the lower right corner denotes 10 kpc. North is up, and east is to the left.
Current usage metrics show cumulative count of Article Views (full-text article views including HTML views, PDF and ePub downloads, according to the available data) and Abstracts Views on Vision4Press platform.
Data correspond to usage on the plateform after 2015. The current usage metrics is available 48-96 hours after online publication and is updated daily on week days.
Initial download of the metrics may take a while.