Free Access
Fig. 5.
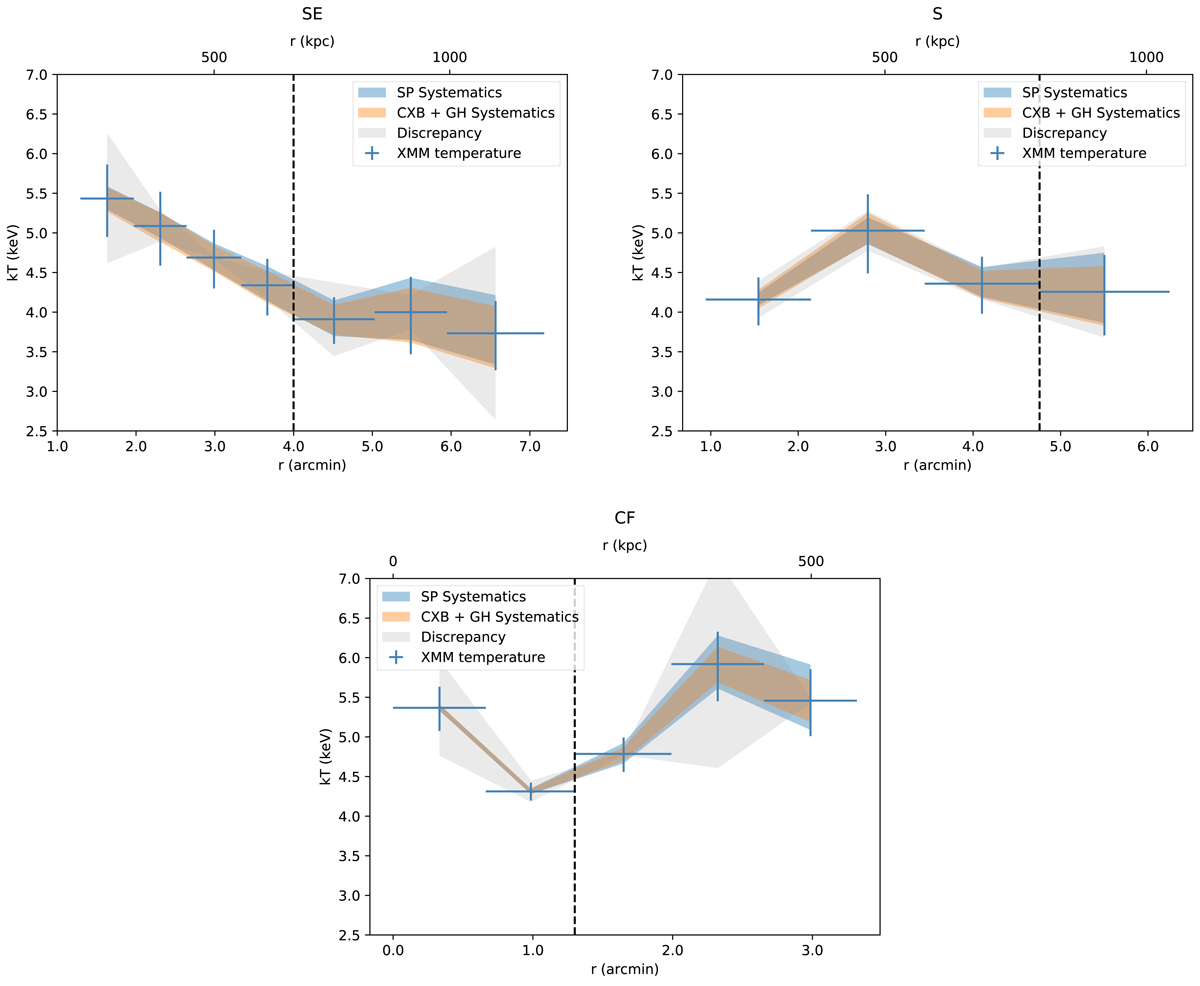
XMM-Newton temperature profile of each region. Dashed lines indicate edge locations fitted from surface brightness profiles. Grey bands indicate the temperature discrepancy between MOS and pn.
Current usage metrics show cumulative count of Article Views (full-text article views including HTML views, PDF and ePub downloads, according to the available data) and Abstracts Views on Vision4Press platform.
Data correspond to usage on the plateform after 2015. The current usage metrics is available 48-96 hours after online publication and is updated daily on week days.
Initial download of the metrics may take a while.