Fig. 4.
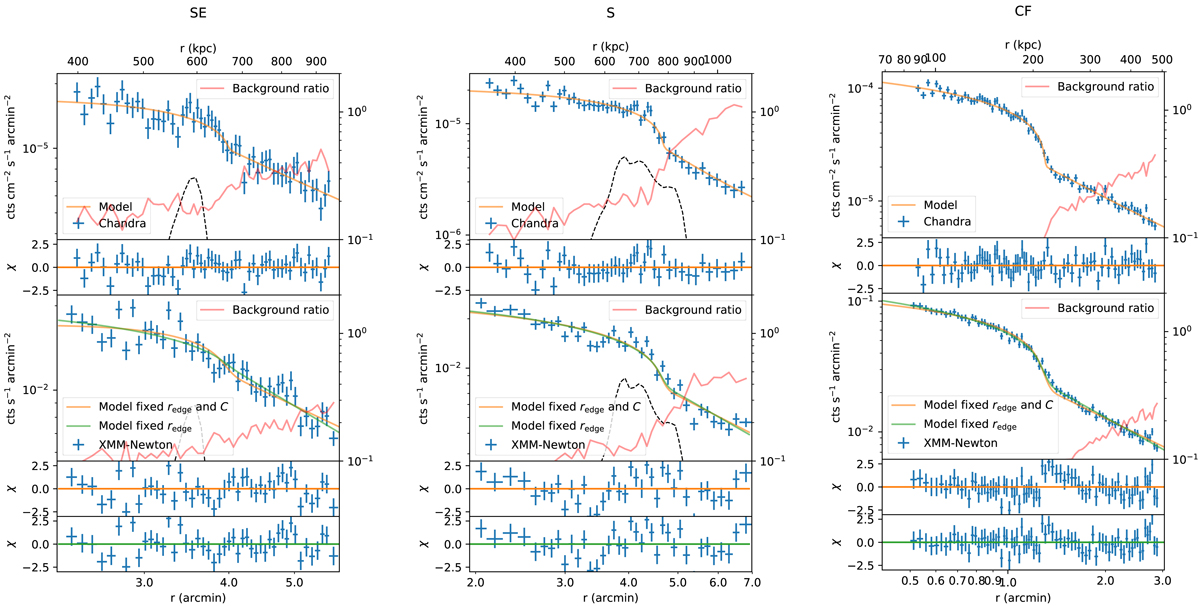
Surface brightness profile fitting results of SE, S, and cold front (CF) regions. Upper panel: Chandra surface brightness. Lower panel: XMM-Newton surface brightness profile fitted by fixed and free C parameters. All XMM-Newton models are smoothed by a σ = 0.1′ Gaussian function. Red lines indicate the ratio between the subtracted FWC background counts and the remaining signal, which include the ICM, X-ray background, and soft proton contamination. In regions where this ratio is higher than one, the FWC background dominates. Black dashed lines are the radio surface brightness profiles in an arbitrary unit.
Current usage metrics show cumulative count of Article Views (full-text article views including HTML views, PDF and ePub downloads, according to the available data) and Abstracts Views on Vision4Press platform.
Data correspond to usage on the plateform after 2015. The current usage metrics is available 48-96 hours after online publication and is updated daily on week days.
Initial download of the metrics may take a while.