Fig. 2.
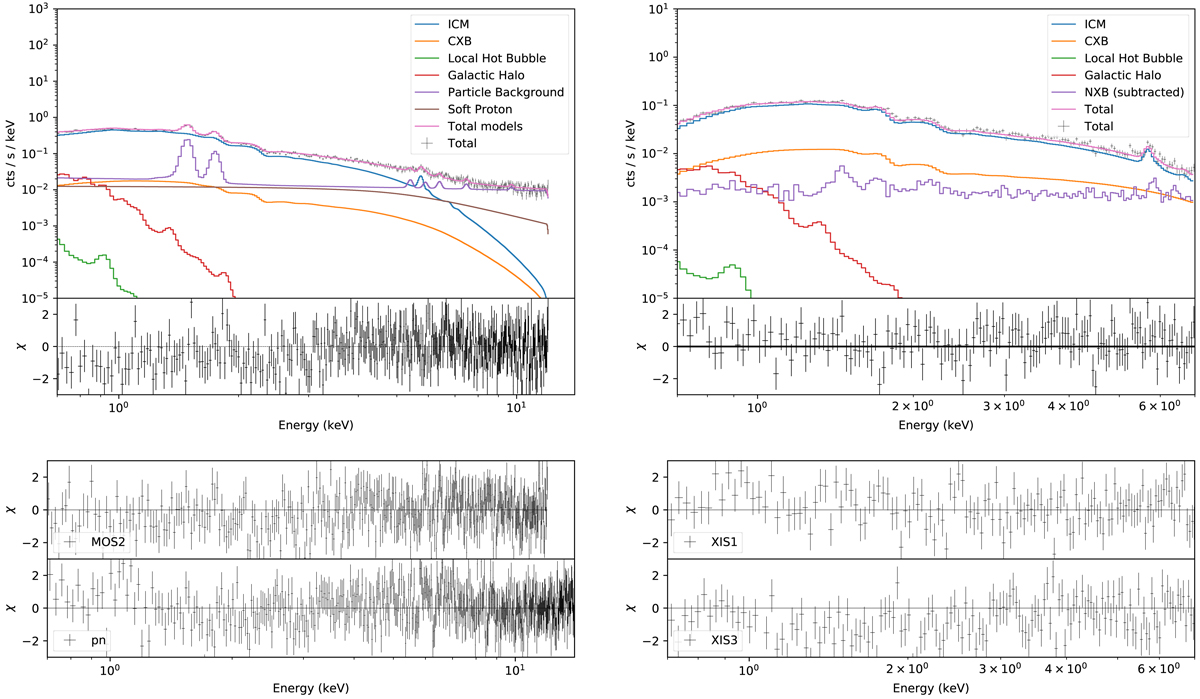
r500XMM-Newton-EPIC MOS1 (top left) and Suzaku XIS0 (top right) spectra as well as individual spectral components. We also plot residuals from the other two EPIC detectors (bottom left) and XIS detectors (bottom right). The fit statistics are C − stat/d.o.f = 1992/1554 for XMM-Newton EPIC spectra and C − stat/d.o.f = 563/423 for Suzaku XIS spectra.
Current usage metrics show cumulative count of Article Views (full-text article views including HTML views, PDF and ePub downloads, according to the available data) and Abstracts Views on Vision4Press platform.
Data correspond to usage on the plateform after 2015. The current usage metrics is available 48-96 hours after online publication and is updated daily on week days.
Initial download of the metrics may take a while.