Free Access
Fig. C.2.
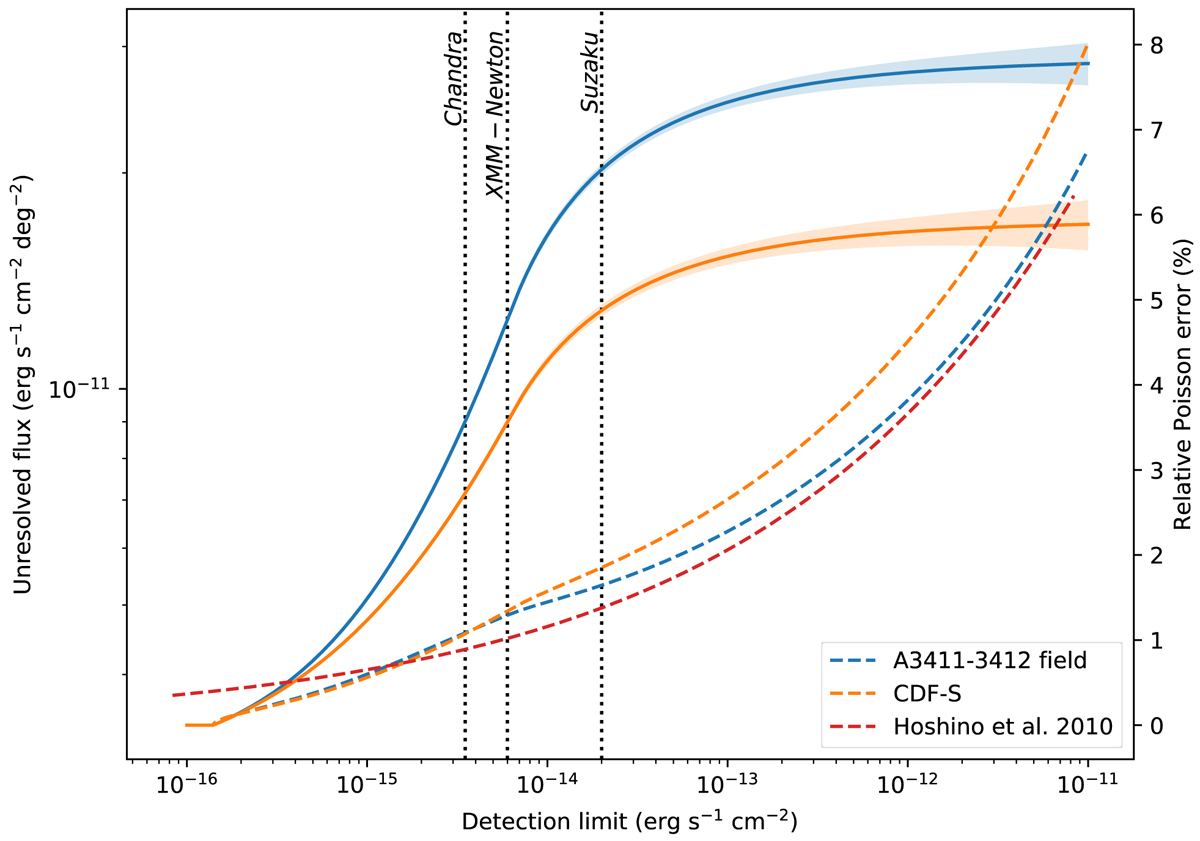
Unresolved CXB flux in the 2–8 keV band as a function of the point-source detection limit. The curves of CDF-S and our field are plotted with orange and blue lines, respectively. Dashed lines indicate the relative poisson error for 1 deg2 sky area.
Current usage metrics show cumulative count of Article Views (full-text article views including HTML views, PDF and ePub downloads, according to the available data) and Abstracts Views on Vision4Press platform.
Data correspond to usage on the plateform after 2015. The current usage metrics is available 48-96 hours after online publication and is updated daily on week days.
Initial download of the metrics may take a while.