Fig. C.1.
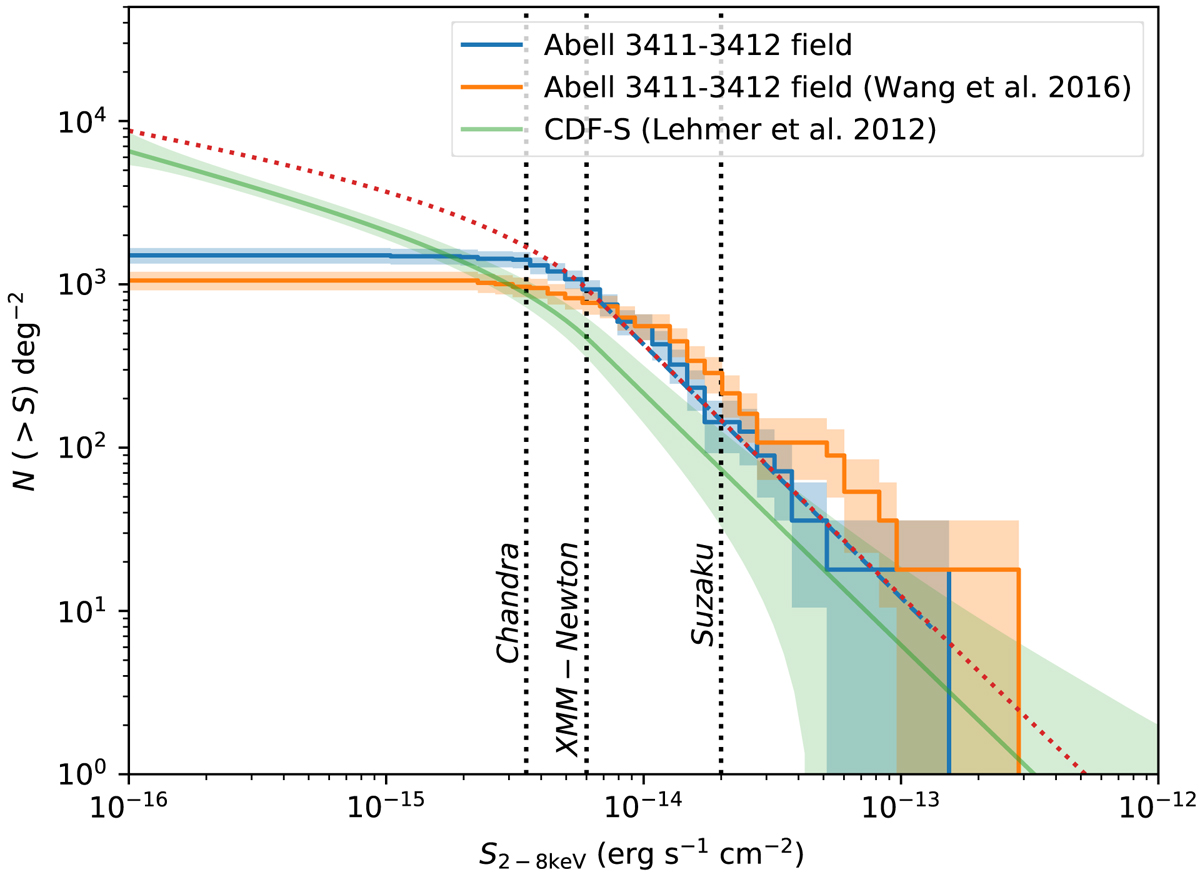
log N − log S curve from Chandra observations. The blue steps are from our analysis of the Abell 3411-3412 field. The best-fit power law is plotted as a blue dashed line. The model we assume to calculate the unresolved CXB in this field is shown as the red dotted line. The orange steps are from the Wang et al. (2016) catalogue of this field. As a comparison, the curve from CDF-S is plotted as a green line. The error of the CDF-S curve includes both Poisson error and the uncertainties on the best-fit parameters. The detection limits of Chandra and XMM-Newton as well as the Suzaku point-source exclusion limit in this paper are marked as vertical dotted lines.
Current usage metrics show cumulative count of Article Views (full-text article views including HTML views, PDF and ePub downloads, according to the available data) and Abstracts Views on Vision4Press platform.
Data correspond to usage on the plateform after 2015. The current usage metrics is available 48-96 hours after online publication and is updated daily on week days.
Initial download of the metrics may take a while.