Free Access
Fig. A.2.
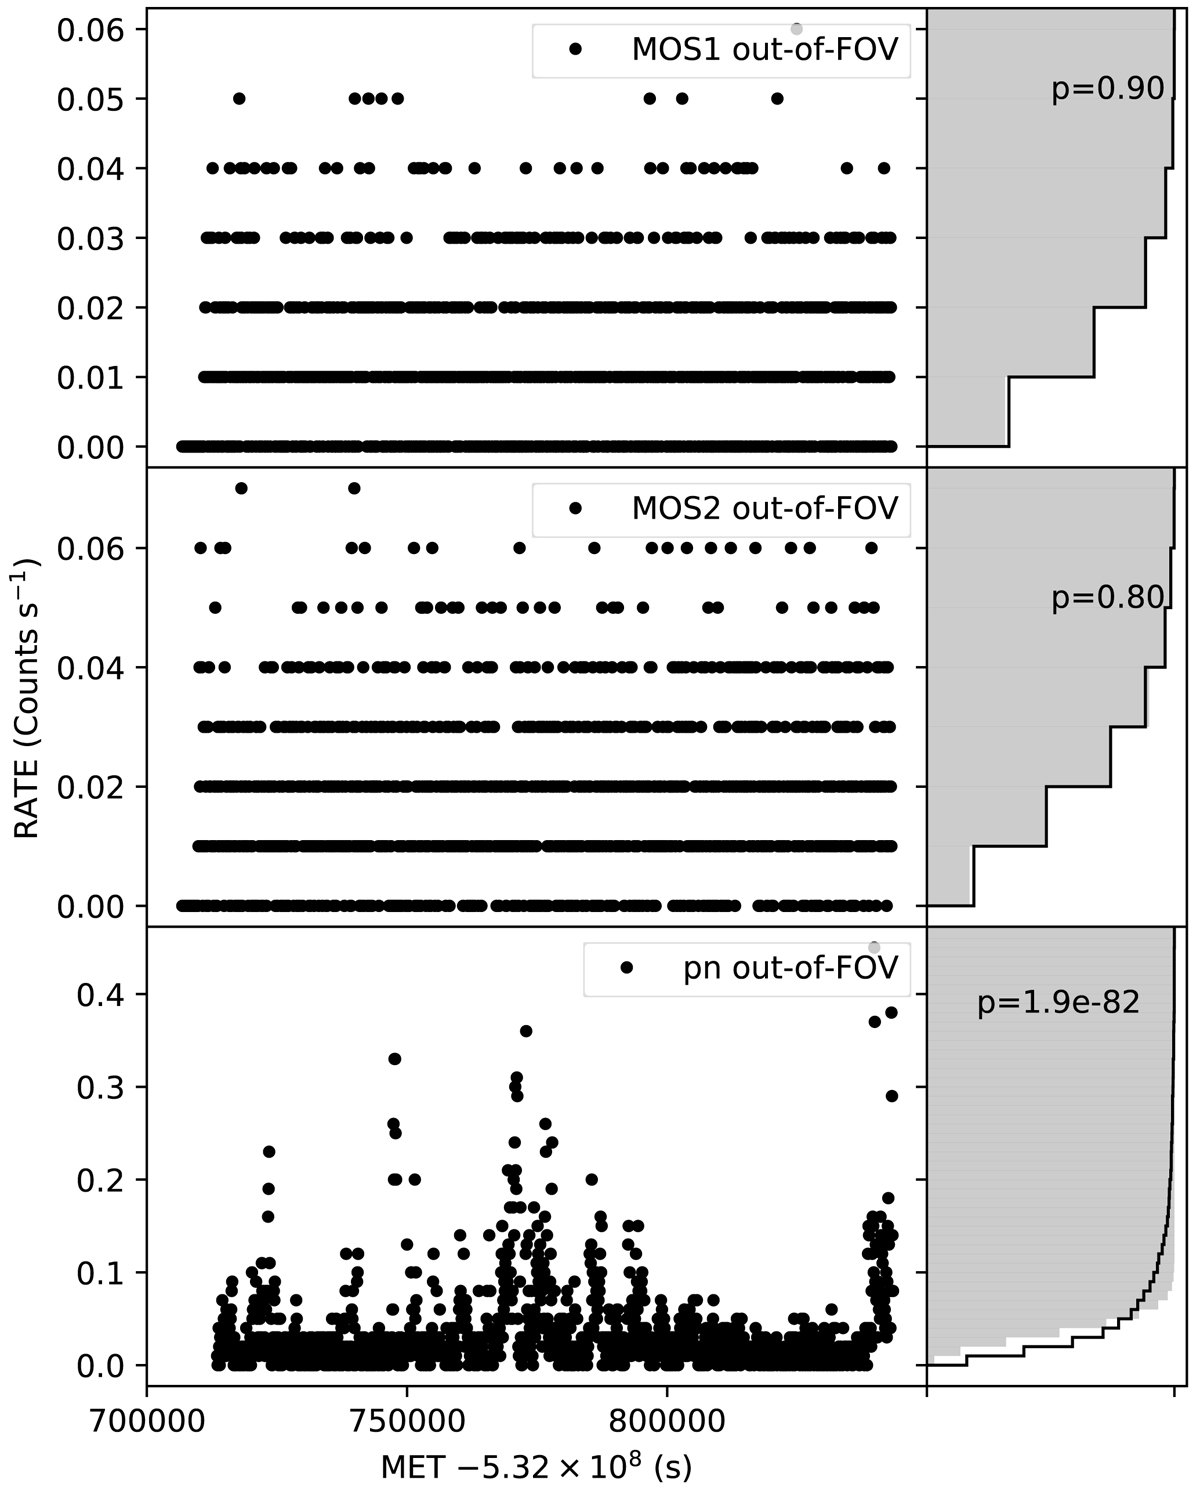
Out-of-FOV 10–12 keV light curves of three EPIC detectors. Right panels: CDFs of count rates. For each light curve, the CDF of the Poisson distribution with μ from the data is plotted as a grey area. The p-values to reject the null hypothesis that the count rate distribution is Poissonian are labelled.
Current usage metrics show cumulative count of Article Views (full-text article views including HTML views, PDF and ePub downloads, according to the available data) and Abstracts Views on Vision4Press platform.
Data correspond to usage on the plateform after 2015. The current usage metrics is available 48-96 hours after online publication and is updated daily on week days.
Initial download of the metrics may take a while.