Fig. 1.
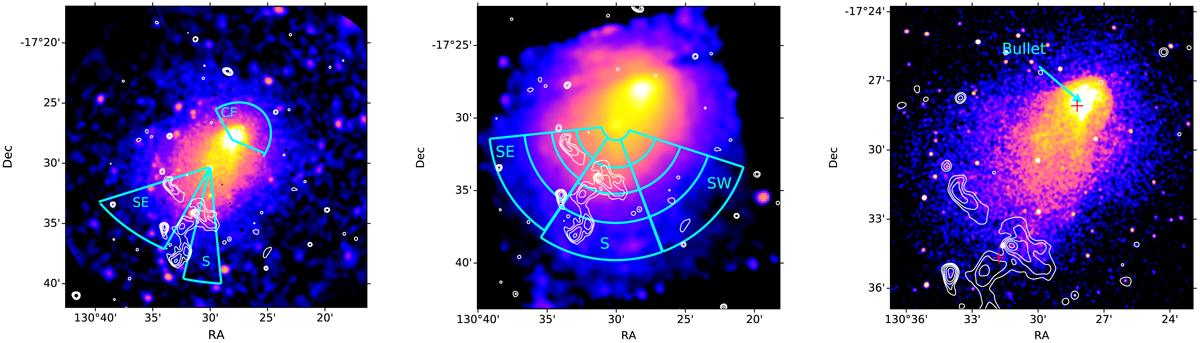
Smoothed flux image of Abell 3411 combined from 1.2–4.0 keV XMM-Newton EPIC CCDs (left), 0.7–7.0 keV Suzaku XIS CCDs (middle), and 1.2–4.0 keV Chandra ACIS-I (right). Particle background and vignetting effect have been corrected. White contours are GMRT 610 MHz radio intensity. XMM-Newton and Suzaku analysis regions are plotted with cyan sectors. The locations of two BCGs are plotted with red crosses in the Chandra image. The coordinates of the BCGs are obtained from Golovich et al. (2019a).
Current usage metrics show cumulative count of Article Views (full-text article views including HTML views, PDF and ePub downloads, according to the available data) and Abstracts Views on Vision4Press platform.
Data correspond to usage on the plateform after 2015. The current usage metrics is available 48-96 hours after online publication and is updated daily on week days.
Initial download of the metrics may take a while.