Fig. 5.
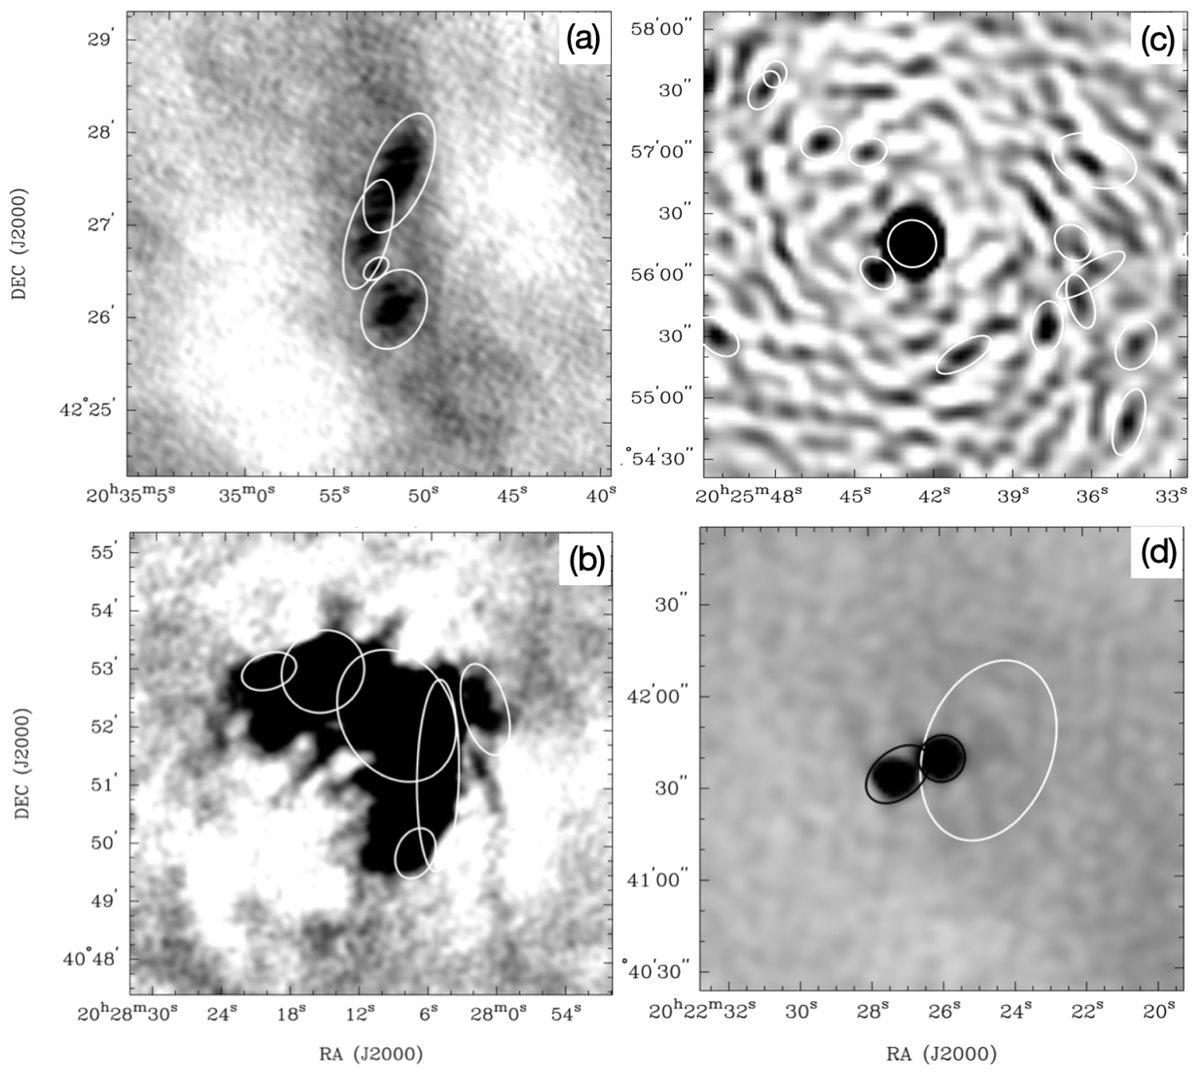
Examples of discarded fits for the four cases given in Sect. 5, represented as white-line ellipses. (a): Filaments and/or diffuse emission at 610 MHz. (b): Strong or large sources that are ill represented by a combination of fits at 325 MHz. (c): Reduction artifacts at 325 MHz. (d): Fits of emission similar to the noise at 610 MHz; in this last case, the fits accepted as good fits are shown with black-line ellipses.
Current usage metrics show cumulative count of Article Views (full-text article views including HTML views, PDF and ePub downloads, according to the available data) and Abstracts Views on Vision4Press platform.
Data correspond to usage on the plateform after 2015. The current usage metrics is available 48-96 hours after online publication and is updated daily on week days.
Initial download of the metrics may take a while.