Fig. 13.
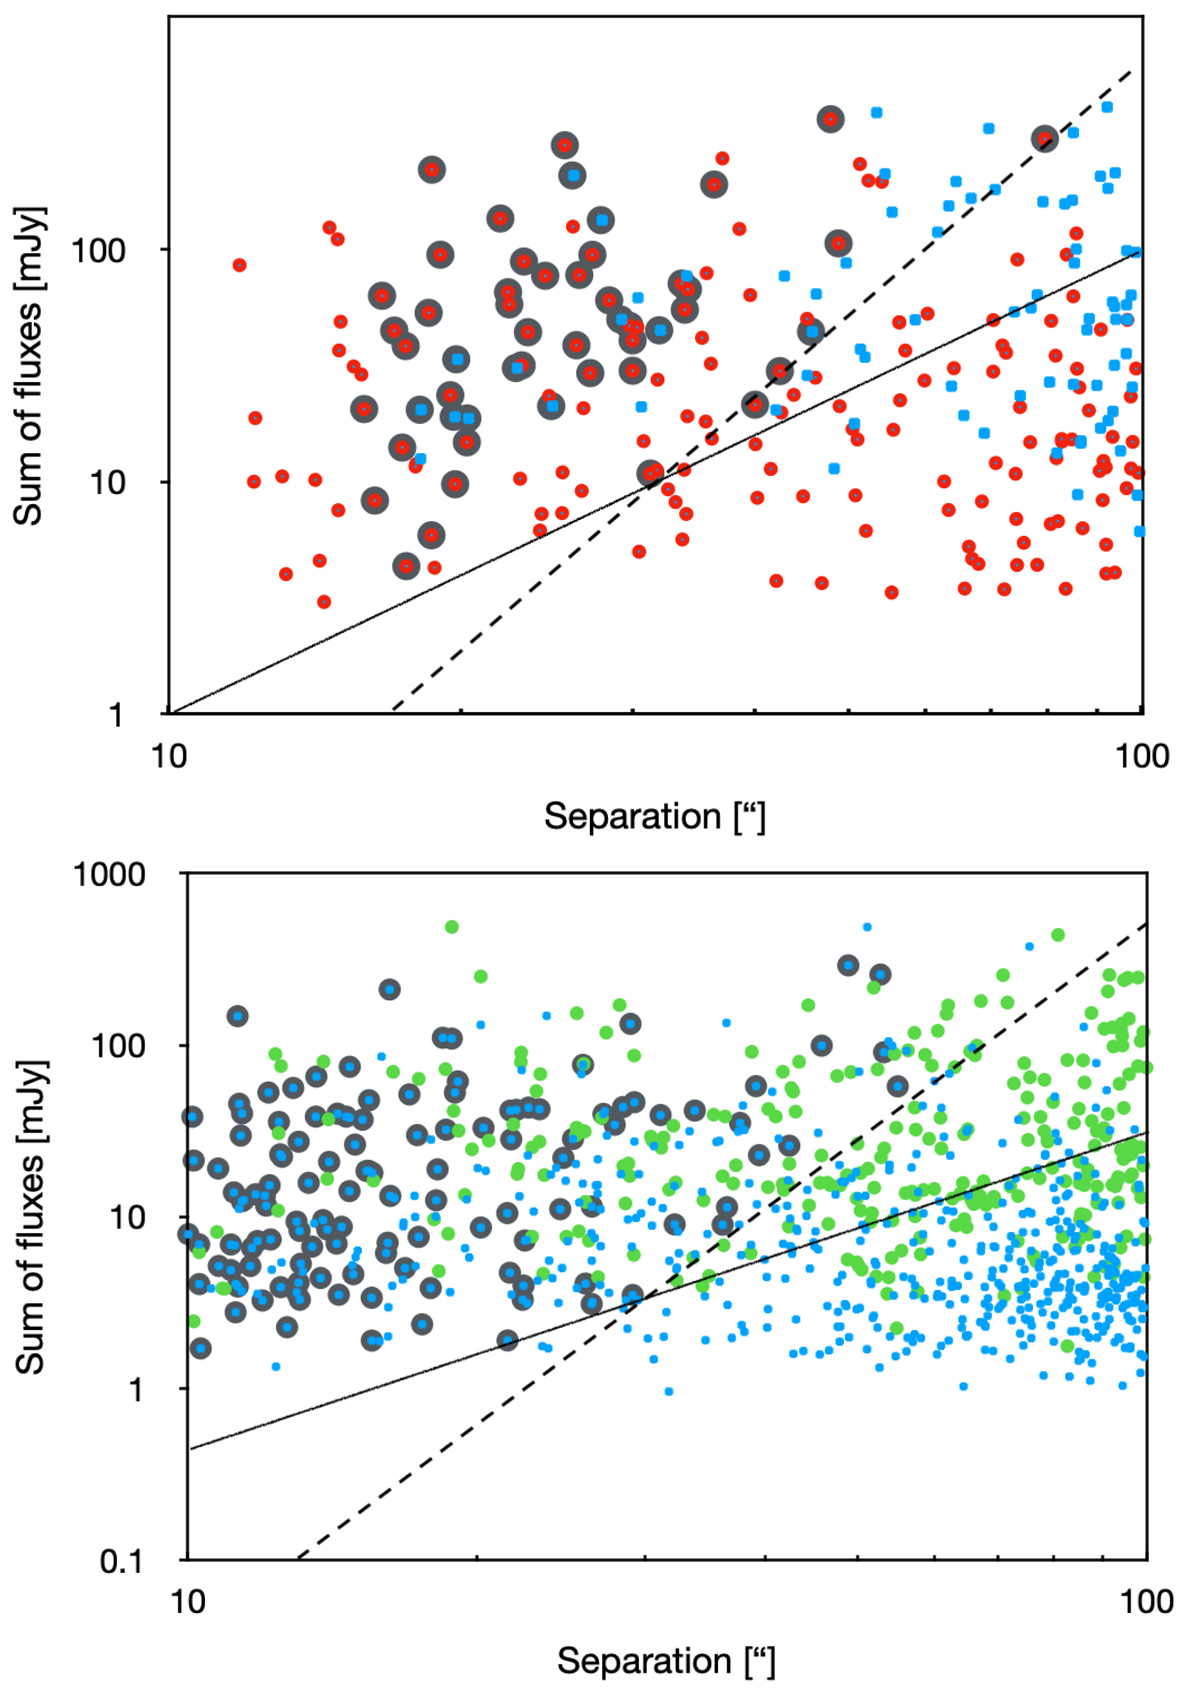
Sum of the flux densities from pairs of nearby sources (FS) vs. source separation (x). Top panel: 325 MHz sources; in red, pairs of sources whose flux ratio (integrated/peak) is below 4; in blue, the rest; larger dark gray circles: pairs of confirmed double sources (see text). Dashed line: (x/16)3.5. Thin solid line: (x/10)2. Bottom panel: for 610 MHz sources; in green, pairs of sources whose flux ratio is below 4; in blue, the rest; larger dark gray circles: pairs of double sources (see text). Dashed line: (x/20)3.5. Thin solid line: (x/16)2.
Current usage metrics show cumulative count of Article Views (full-text article views including HTML views, PDF and ePub downloads, according to the available data) and Abstracts Views on Vision4Press platform.
Data correspond to usage on the plateform after 2015. The current usage metrics is available 48-96 hours after online publication and is updated daily on week days.
Initial download of the metrics may take a while.