Fig. 8
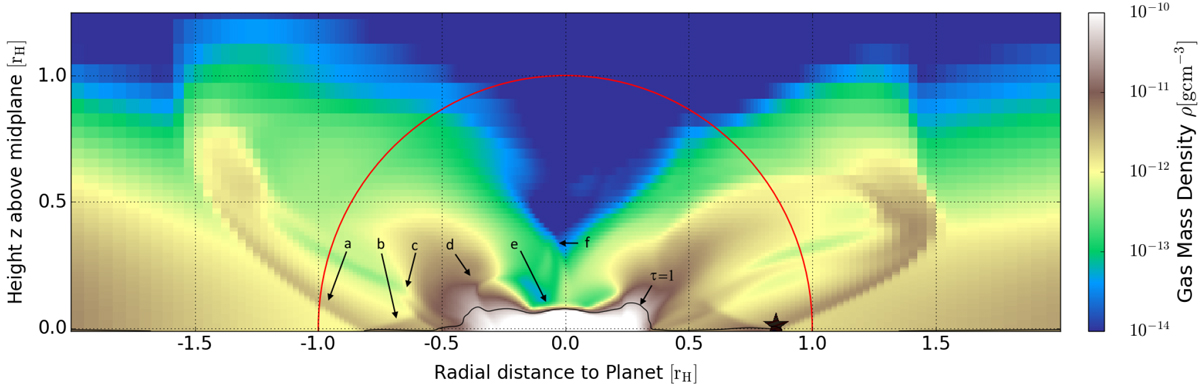
Overview of density structures in a vertical cut through the non-circled star-symbol along the y = 0-axis in Fig. 3 for the nominal simulation run C1. The red circle marks the approximate Hill sphere. An approximate boundary of the CPD is the vertically integrated optical thin–thick transition, marked as τ = 1. Features arelabelled identically to the temperature plot (below) with letters as follows: classical spiral arm (a), midplane free-fall region (b), (midplane) accretion shock into the CPD (c), CPD spiral arm (d), vertical accretion shock (e), and accretion funnel from colliding flows (f).
Current usage metrics show cumulative count of Article Views (full-text article views including HTML views, PDF and ePub downloads, according to the available data) and Abstracts Views on Vision4Press platform.
Data correspond to usage on the plateform after 2015. The current usage metrics is available 48-96 hours after online publication and is updated daily on week days.
Initial download of the metrics may take a while.