Fig. A.1
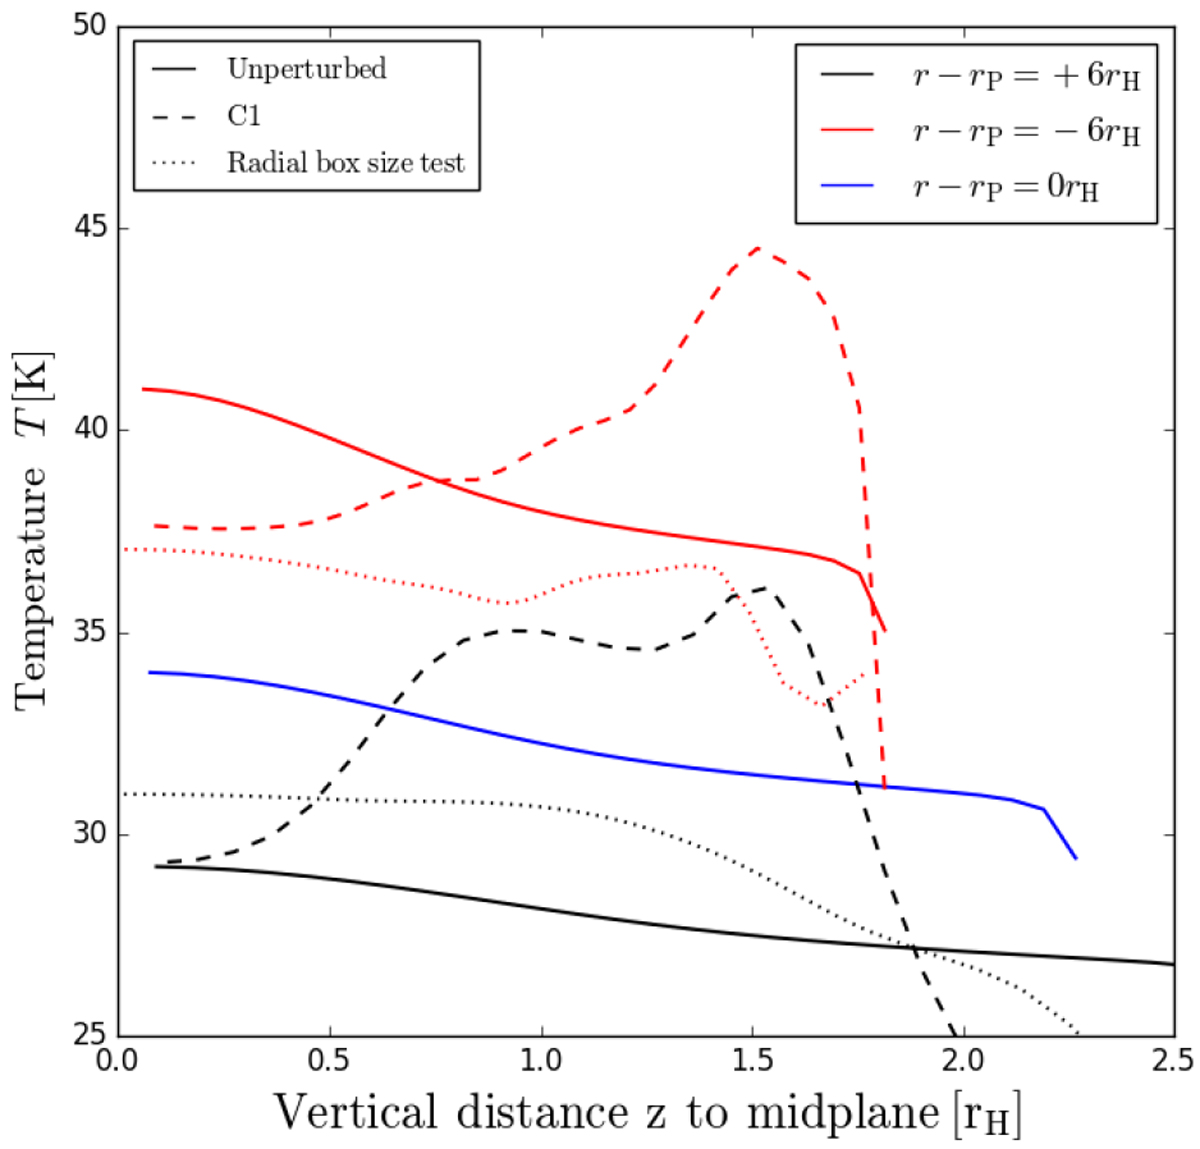
Vertical, unperturbed temperature profile after 400 orbits before the planet is injected (solid red, blue, and black lines) plotted against the distance to the midplane in units of the future planet. Radial positions of the profiles are given in the plot, the azimuthal position is always θ = 0. The abrupt temperature decrease at the upper simulation boundary is due to the 3K boundary condition, but does not influence the simulation result because the disc there is optically thin. Dashed and dotted lines are after five orbits of the simulation C1 and a control simulation with a larger radial box size, respectively. Blue for the r = 0 in the high-resolution runs is not plotted, as it appears in Figs. 11 and 15.
Current usage metrics show cumulative count of Article Views (full-text article views including HTML views, PDF and ePub downloads, according to the available data) and Abstracts Views on Vision4Press platform.
Data correspond to usage on the plateform after 2015. The current usage metrics is available 48-96 hours after online publication and is updated daily on week days.
Initial download of the metrics may take a while.