Fig. 12
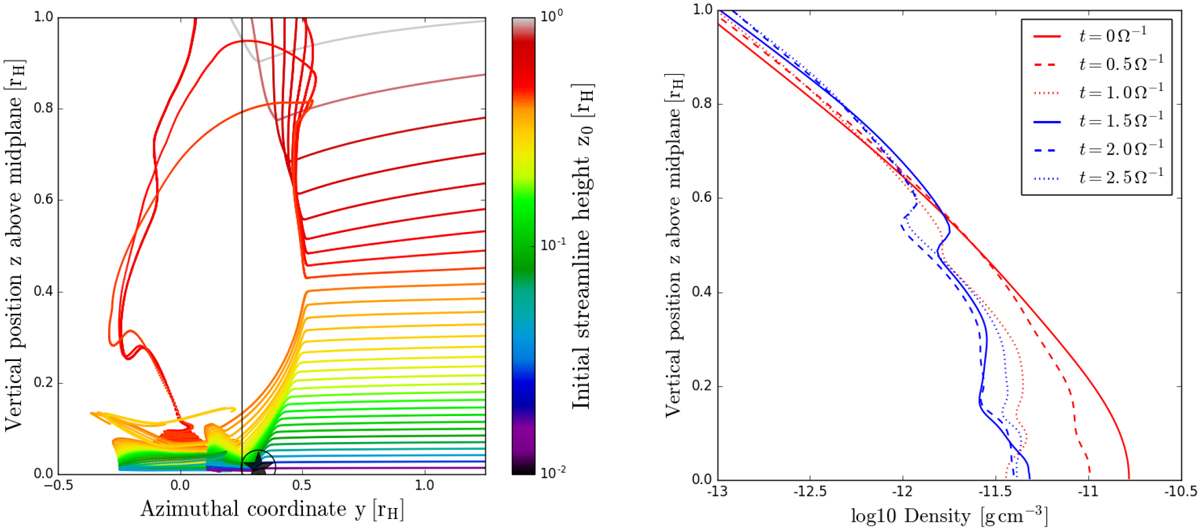
Vertical side view of 3D-integrated streamlines (left) going through the circled-star-position in Fig. 3. We note that here we show the y–z plane. Streamlines are coloured according to starting height for purposes of distinguishing them. The circled star (bottom of the plot) is at the same 3D coordinates as before. A flow separation occurs at around z = 0.41rH dividing the streamlines into strongly shocked upwards and strongly shocked downwards flows. Scanning through horizontally adjacent streamline families reveals that this phenomenon is responsible for leaving the entire column volume behind the shock devoid of streamlines with the ability to replenish the missing mass. Evolution of the free-fall region at the vertical black line (right). Density profiles are shown evolving in time at the position indicated by the line in the left figure. The formation timescale of the FFR can be read-off as ≈2 Ω−1. See Fig. 6 for a density map during the formation process.
Current usage metrics show cumulative count of Article Views (full-text article views including HTML views, PDF and ePub downloads, according to the available data) and Abstracts Views on Vision4Press platform.
Data correspond to usage on the plateform after 2015. The current usage metrics is available 48-96 hours after online publication and is updated daily on week days.
Initial download of the metrics may take a while.