Fig. 9.
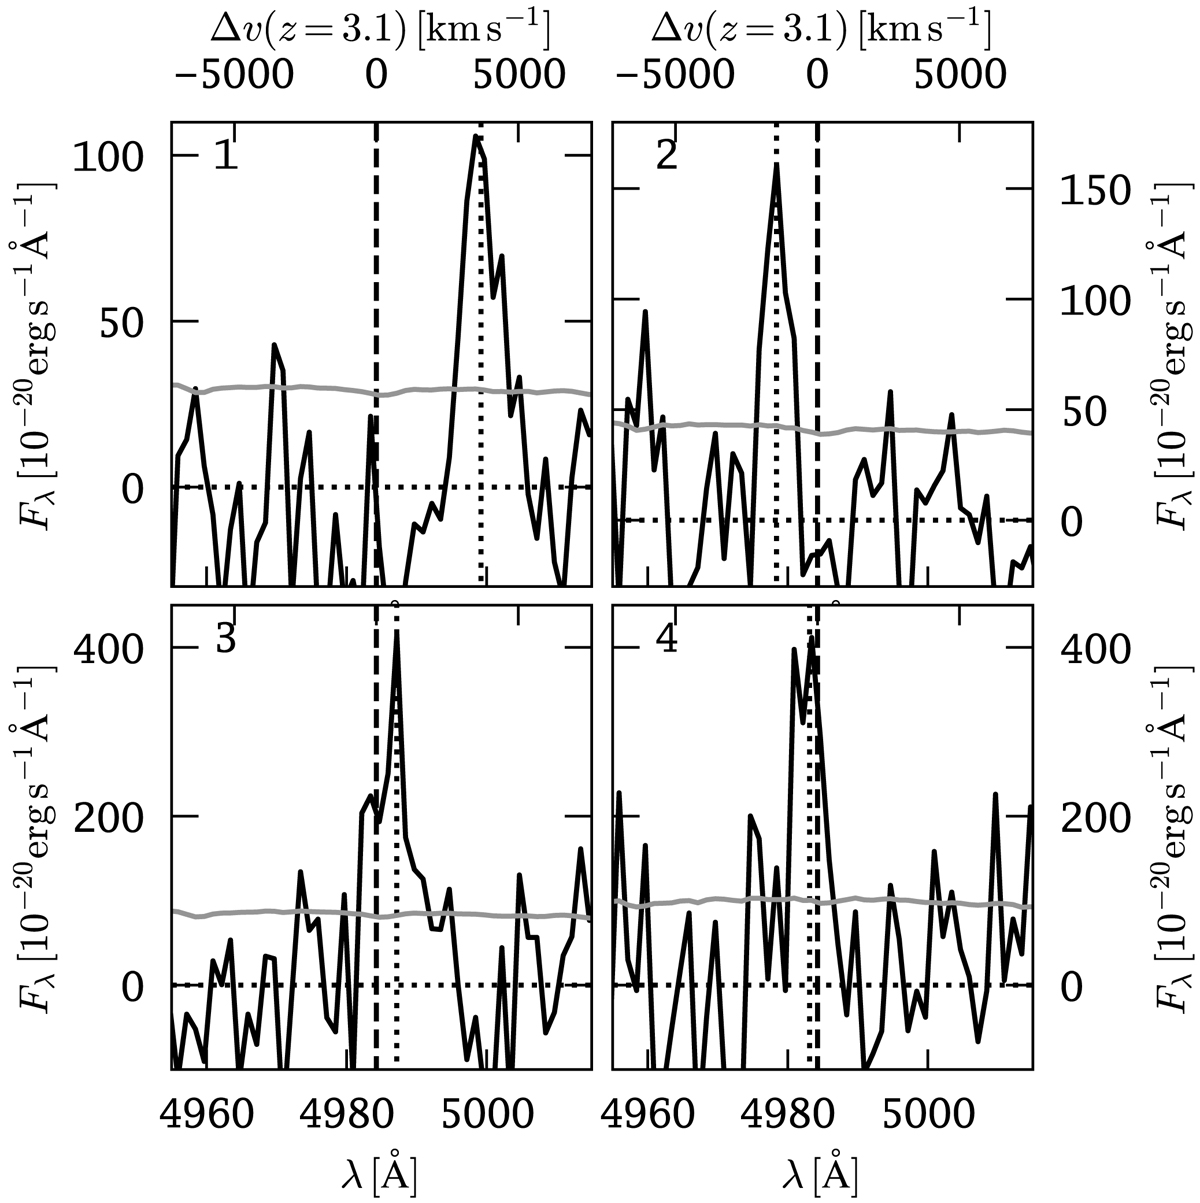
Spectral profiles of the newly discovered LAEs 1 – 4 (as labelled in Fig. 4, clockwise from top-left to bottom-right). Spectra (black lines) have been extracted within a circular aperture of radius Rkron (see Table 3). The propagated error spectrum from the variance cube in this aperture is shown as a grey line. The vertical dashed line indicates zLyα = 3.1, whereas the vertical dotted lines indicate the measured redshifts from the profiles (see Table 3).
Current usage metrics show cumulative count of Article Views (full-text article views including HTML views, PDF and ePub downloads, according to the available data) and Abstracts Views on Vision4Press platform.
Data correspond to usage on the plateform after 2015. The current usage metrics is available 48-96 hours after online publication and is updated daily on week days.
Initial download of the metrics may take a while.