Fig. 7.
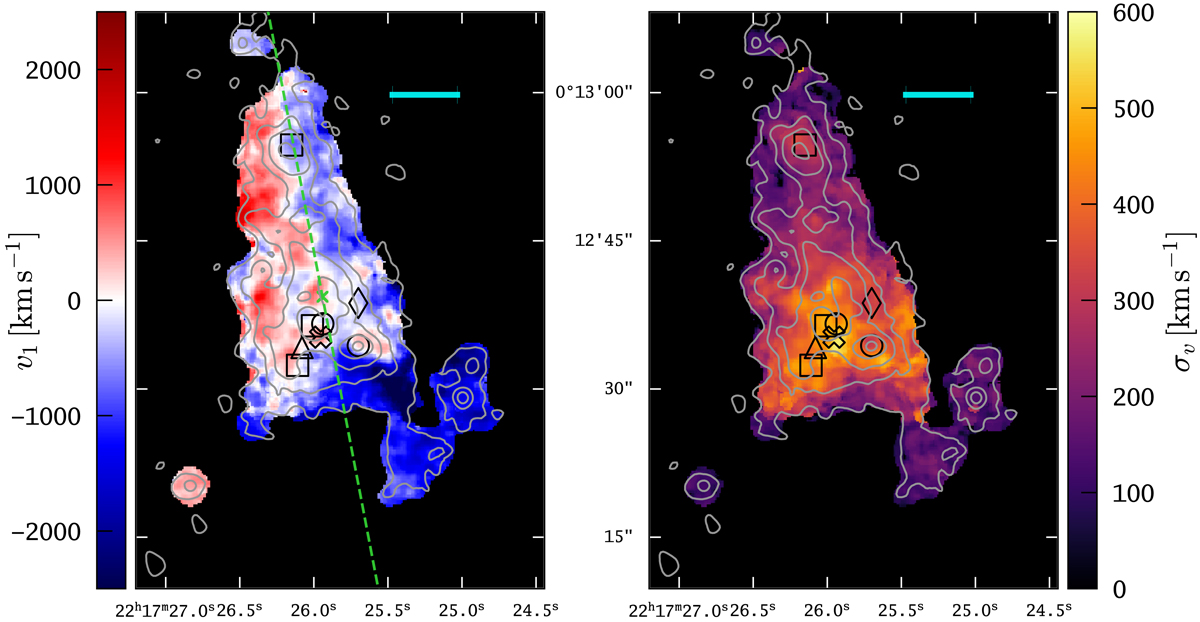
Apparent line-of-sight-velocity (left panel) and apparent velocity dispersion (right panel) as measured from Lyα using the first and second flux weighted moments (Eqs. (7) and (8)). Before the moment-based analysis was carried out, each layer of the datacube was spatially smoothed with a σ = 0.8″ Gaussian kernel. In each spaxel, only spectral bins above a S/N threshold of four in the LSDCat S/N datacube were used in the summations in Eqs. (5) and (6). Moreover, the displayed map shows only spaxels that have a maximum S/N > 6. Thin grey contours indicate surface-brightness levels SBLyα = [200, 100, 50, 25, 8.75] × 10−19 erg s−1 cm−2 arcsec−2 as measured in the adaptive narrow-band image (Fig. 5). The positions of confirmed galaxies within the blob are indicated with the same symbols as in Fig. 1. The photometric centre and the principal axis of the blob (see Sect. 5.2 and Fig. 5) are indicated by a green cross and a green dashed line, respectively. The horizontal cyan line in the upper right of each panel indicates a projected proper distance of 50 kpc.
Current usage metrics show cumulative count of Article Views (full-text article views including HTML views, PDF and ePub downloads, according to the available data) and Abstracts Views on Vision4Press platform.
Data correspond to usage on the plateform after 2015. The current usage metrics is available 48-96 hours after online publication and is updated daily on week days.
Initial download of the metrics may take a while.