Fig. 6.
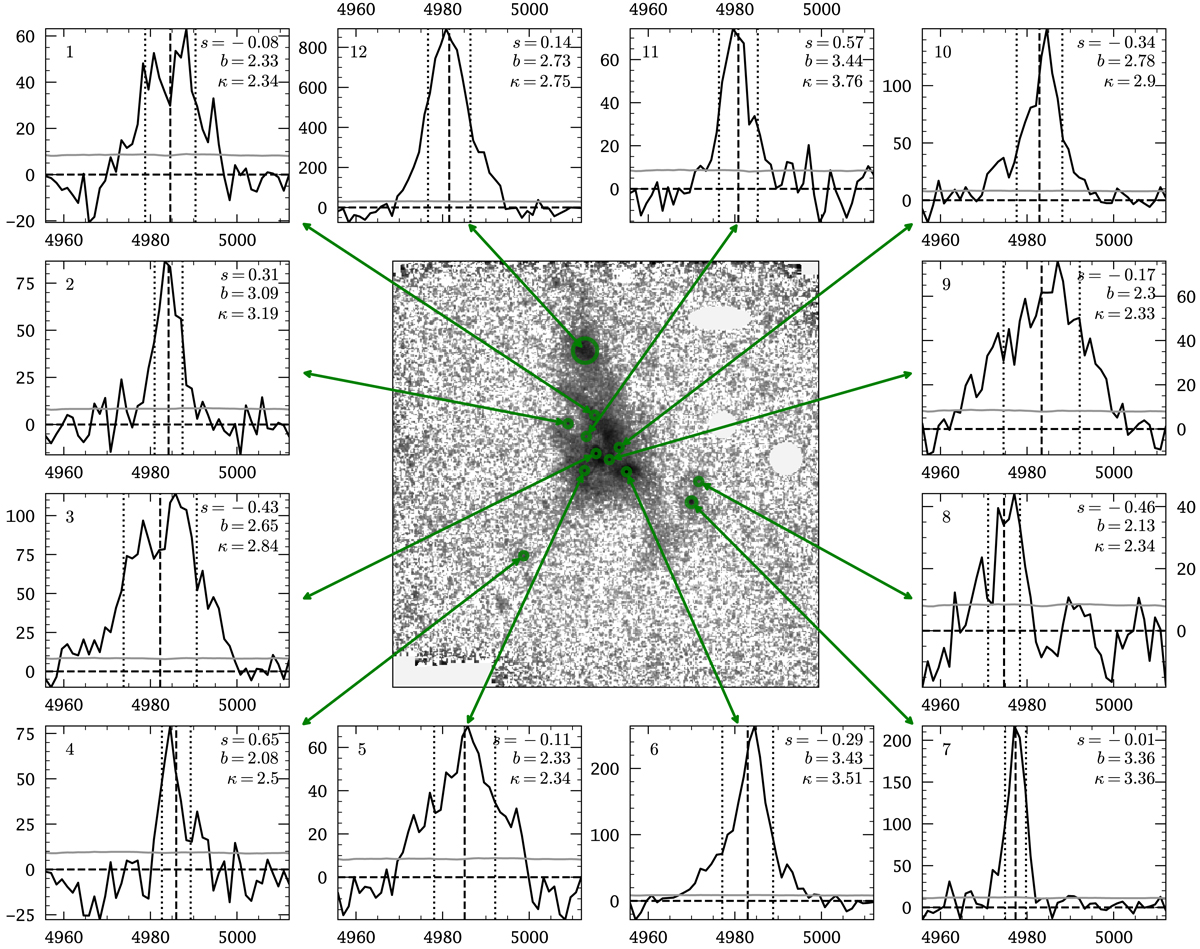
Examples of the variety and complexity of the Lyα line profiles encountered in LAB 1. All profiles are extracted in circular apertures of 1.2″ diameter, except for LAB 8, where a 4″ diameter aperture was used. The image in the centre is the adaptive narrow-band image shown in Fig. 5, but in a logarithmic scale. Green circles represent the extraction apertures with lines connecting to the individual panels that display the profiles. Four of the twelve panels show Lyα profiles at the position of known galaxies: LAB1-ALMA3 in panel 5, SSA22a-C11 in panel 6, LAB1-ALMA1 and LAB1-ALMA2 in panel 9, and SSA22a-C15 (LAB 8) in panel 12. For each profile, the wavelength axis (in Å) is fixed and centred on zLyα = 3.1, but the axis displaying the intensity (in erg s−1 cm−2 Å−1) is scaled to encompass the maximum flux value of each profile. We also indicate in each panel the flux-weighted central moment (Eq. (5), dashed line), and the non-parametric measure for the width of the line obtained from the second flux-weighted moment (from Eq. (6) with k = 2, dotted lines). Moreover, we display in the upper right corner of each panel the non-parametric descriptive measures skewness s (Eq. (10)), kurtosis κ (Eq. (11)), and bi-modality b (Eq. (12)) – see text for details. All non-parametric descriptive statistics are computed by considering only the range of connected positive spectral bins blue- and red-wards of the peak.
Current usage metrics show cumulative count of Article Views (full-text article views including HTML views, PDF and ePub downloads, according to the available data) and Abstracts Views on Vision4Press platform.
Data correspond to usage on the plateform after 2015. The current usage metrics is available 48-96 hours after online publication and is updated daily on week days.
Initial download of the metrics may take a while.