Fig. 5.
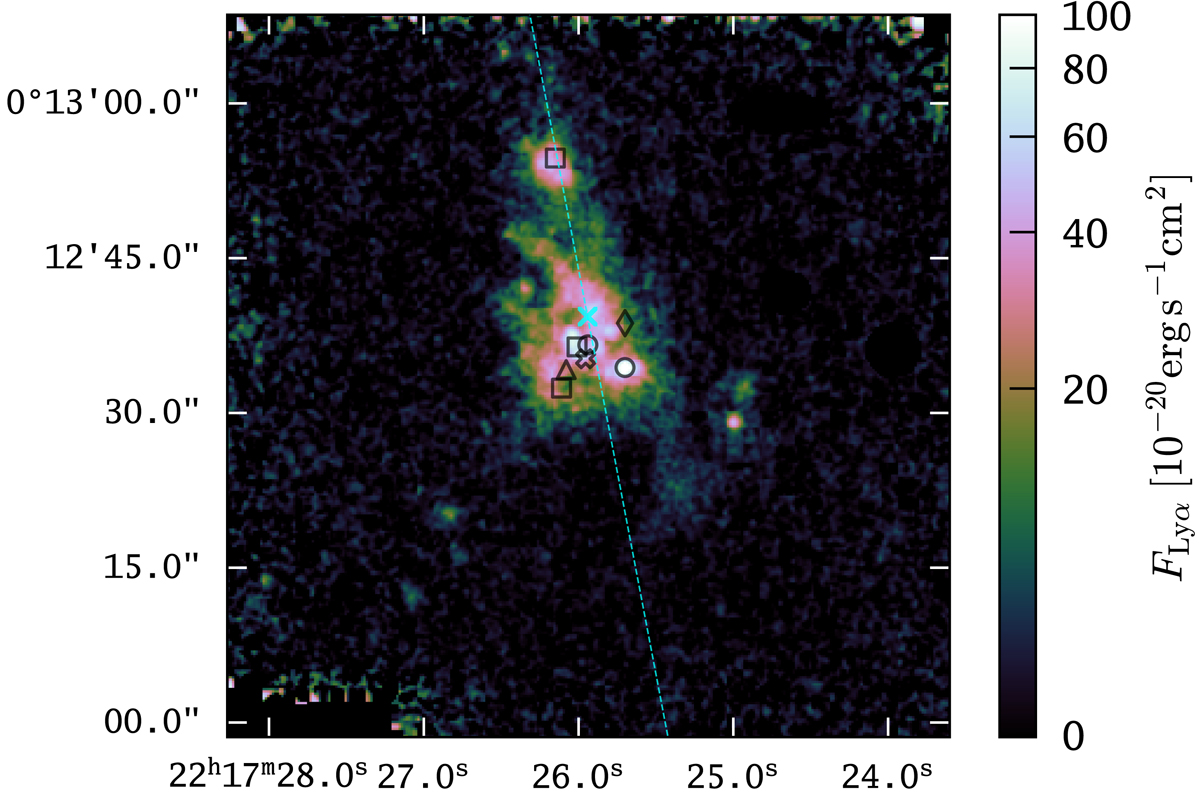
Adaptive narrow-band image of LAB1. The image is the result of summing only over voxels in the continuum-subtracted datacube that have a S/N > 4 in the LSDCat cross-correlated datacube. For spaxels that do not contain voxels above this threshold we simply sum over 5 Å (four datacube layers) around 4985.6 Å (=(1 + zLAB1) × λLyα). As in Fig. 4, we masked sources where the continuum subtraction with a running median filter failed. In order to further enhance low-SB Lyα features, we smoothed the final image with a σ = 0.2″ Gaussian kernel. The photometric centre and the principal axis of the blob are indicated by a cyan cross and a cyan dashed line, respectively. Previously known galaxies at z = 3.1 are indicated using the same symbols as in Fig. 1.
Current usage metrics show cumulative count of Article Views (full-text article views including HTML views, PDF and ePub downloads, according to the available data) and Abstracts Views on Vision4Press platform.
Data correspond to usage on the plateform after 2015. The current usage metrics is available 48-96 hours after online publication and is updated daily on week days.
Initial download of the metrics may take a while.