Fig. 4.
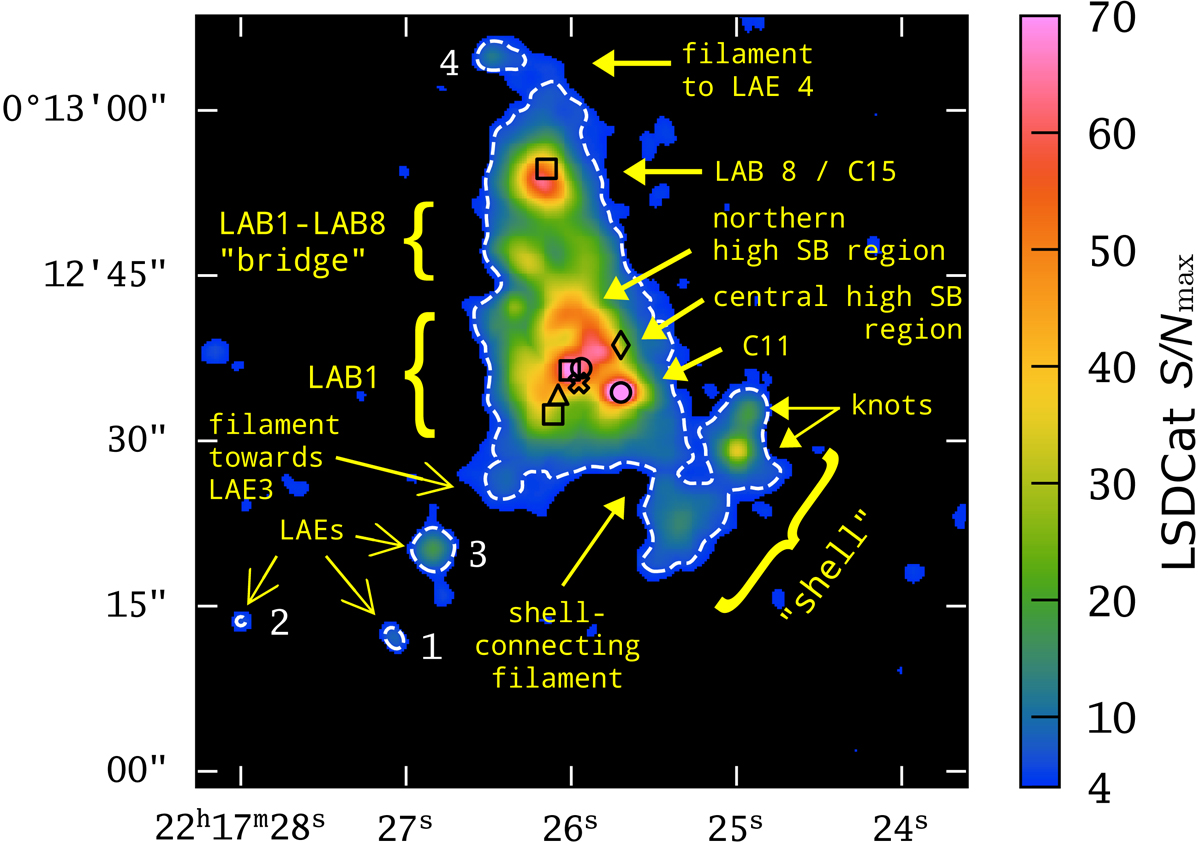
Map of the maximum signal-to-noise ratio (S/N) after cross-correlating the datacube with a 3D Gaussian template (see Sect. 5.2 for details on the construction of this image). Pixels with S/Nmax < 4 and contaminating foreground sources are masked (regions in black). Thus, pixels shown in colour are a 2D projection of the 3D mask utilised to construct the adaptive narrow band image displayed in Fig. 5. The dashed contour demarcates region of connected pixels with S/Nmax ≥ 6. This highlights that LAB 1, LAB 8 and the newly detected shell comprise a significantly detected contiguous region. The four enumerated features in this image are regions that contain pixels with S/Nmax ≥ 6 that have no pixel connectivity at S/Nmax ≥ 6 with the LAB1/LAB8 + shell structure; these detections are LAEs in the vicinity of the blob and are further discussed in Sect. 5.4. Previously known galaxies at z = 3.1 are indicated using the symbols in Fig. 1 and interesting features are annotated.
Current usage metrics show cumulative count of Article Views (full-text article views including HTML views, PDF and ePub downloads, according to the available data) and Abstracts Views on Vision4Press platform.
Data correspond to usage on the plateform after 2015. The current usage metrics is available 48-96 hours after online publication and is updated daily on week days.
Initial download of the metrics may take a while.