Fig. 3.
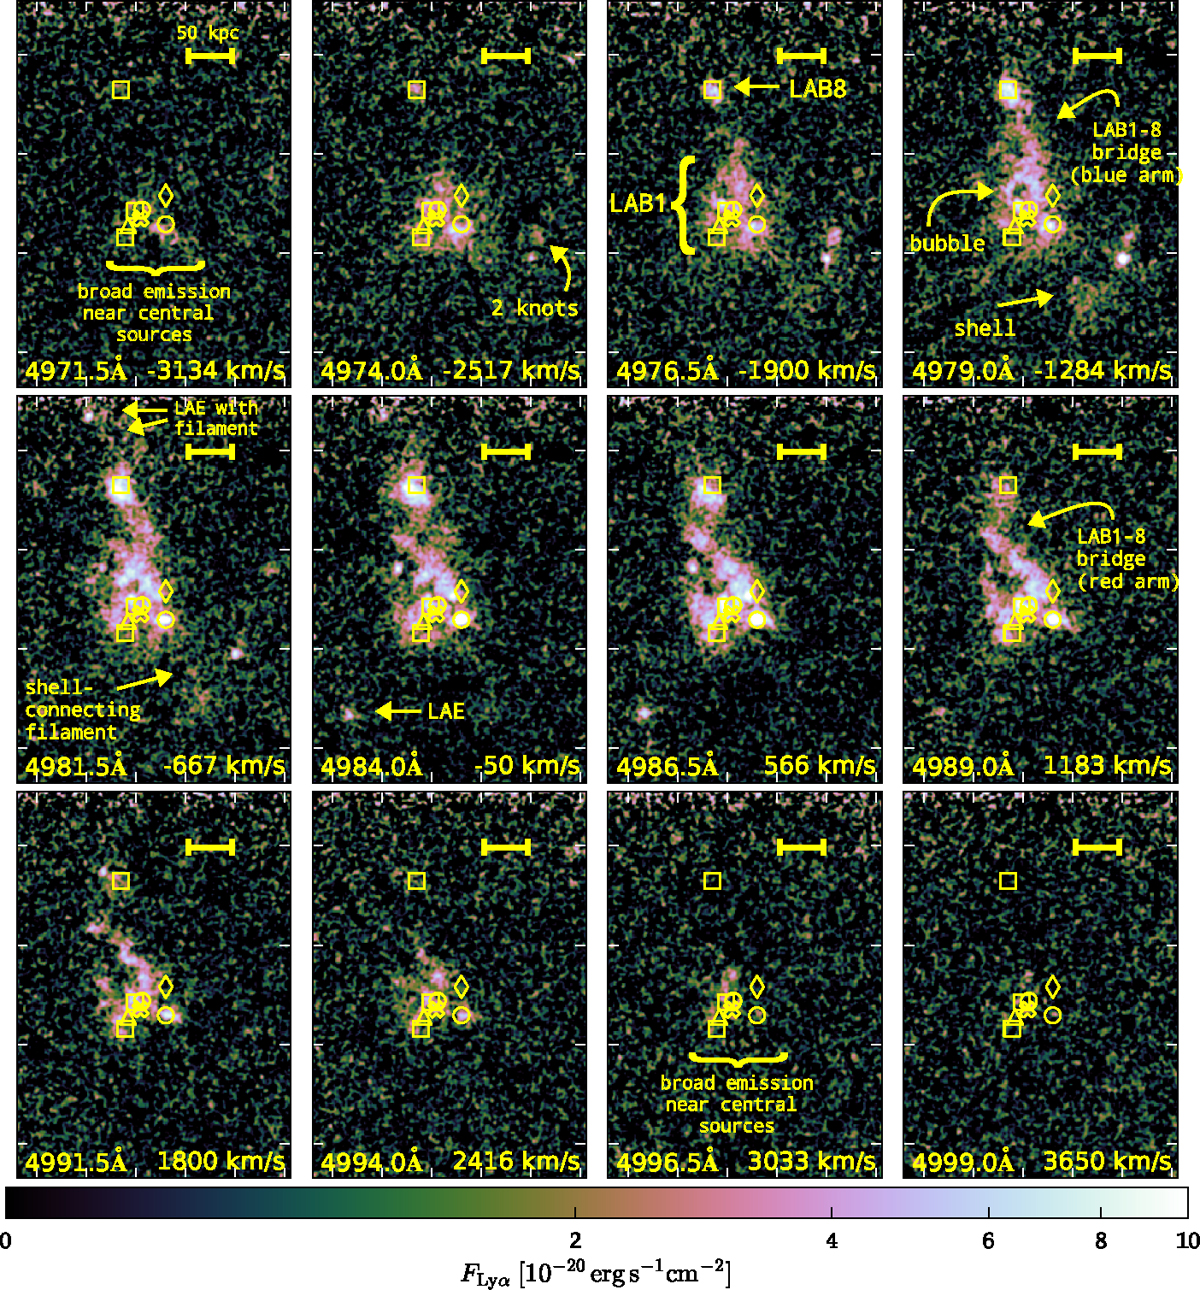
Spectral sequence of pseudo-narrowband images of LAB 1 from 4971.5 Å to 4999.0 Å created from the continuum subtracted MUSE datacube. Each image has a band-width of 2.5 Å and in order to enhance low-surface brightness features the images have been smoothed with a σ = 1 px (0.2″) Gaussian kernel. In each panel, we indicate the positions of known galaxies within the blob (see Sect. 2 and Fig. 1). Moreover, we show in each panel a scale that indicates 50 kpc in projection at z = 3.1 (6.49″). The morphological features described in Sect. 5.1 are indicated in the bluest image where they become visible. We also indicate that we trace Lyα emission ±3000 km s−1 around the central sources of LAB 1. North is up and east is to the left.
Current usage metrics show cumulative count of Article Views (full-text article views including HTML views, PDF and ePub downloads, according to the available data) and Abstracts Views on Vision4Press platform.
Data correspond to usage on the plateform after 2015. The current usage metrics is available 48-96 hours after online publication and is updated daily on week days.
Initial download of the metrics may take a while.