Fig. 2.
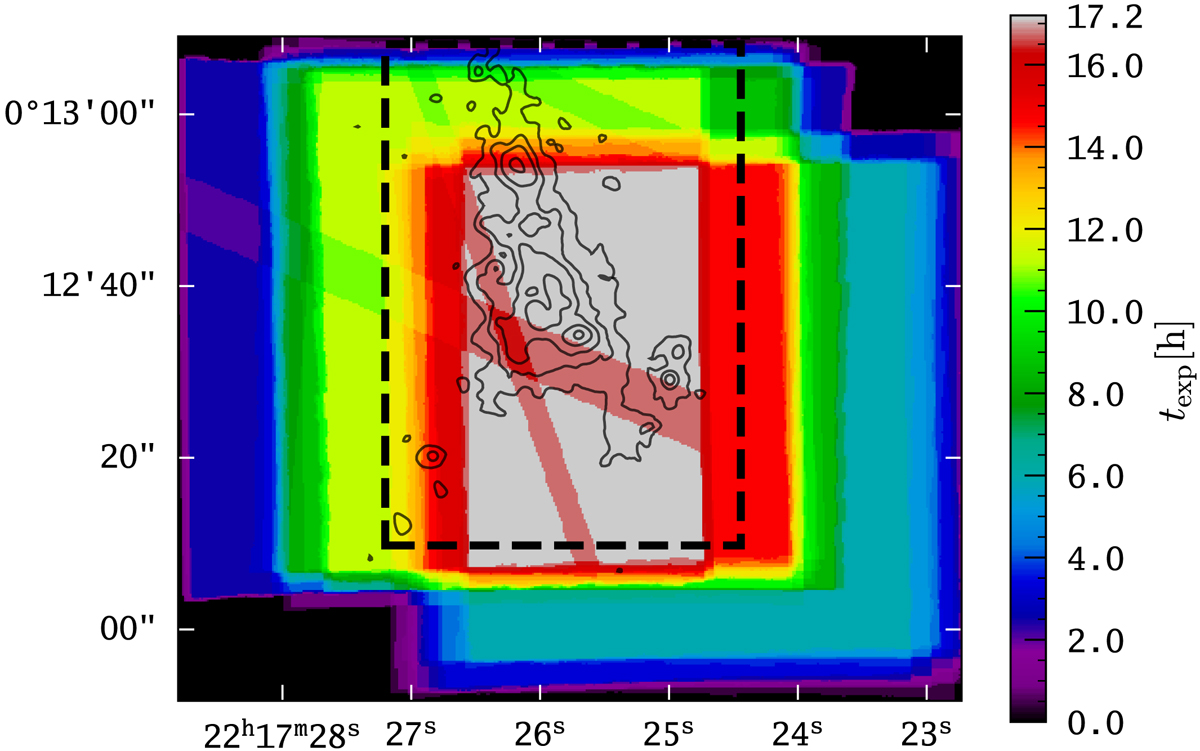
Exposure map image for MUSE observations of LAB1 in the SSA22 field. The dashed rectangle indicates the zoomed-in region displayed in the spectral sequence shown in Fig. 3. Diagonal bands of lower exposure times are a result of masked out regions in the final cube stack due to contamination by bright satellite tracks or meteor trails in the individual exposures. To indicate the position and morphology of LAB 1 we also overlay the Lyα surface brightness contours from our MUSE adaptive narrow-band image (see Sect. 5.2).
Current usage metrics show cumulative count of Article Views (full-text article views including HTML views, PDF and ePub downloads, according to the available data) and Abstracts Views on Vision4Press platform.
Data correspond to usage on the plateform after 2015. The current usage metrics is available 48-96 hours after online publication and is updated daily on week days.
Initial download of the metrics may take a while.