Fig. 14.
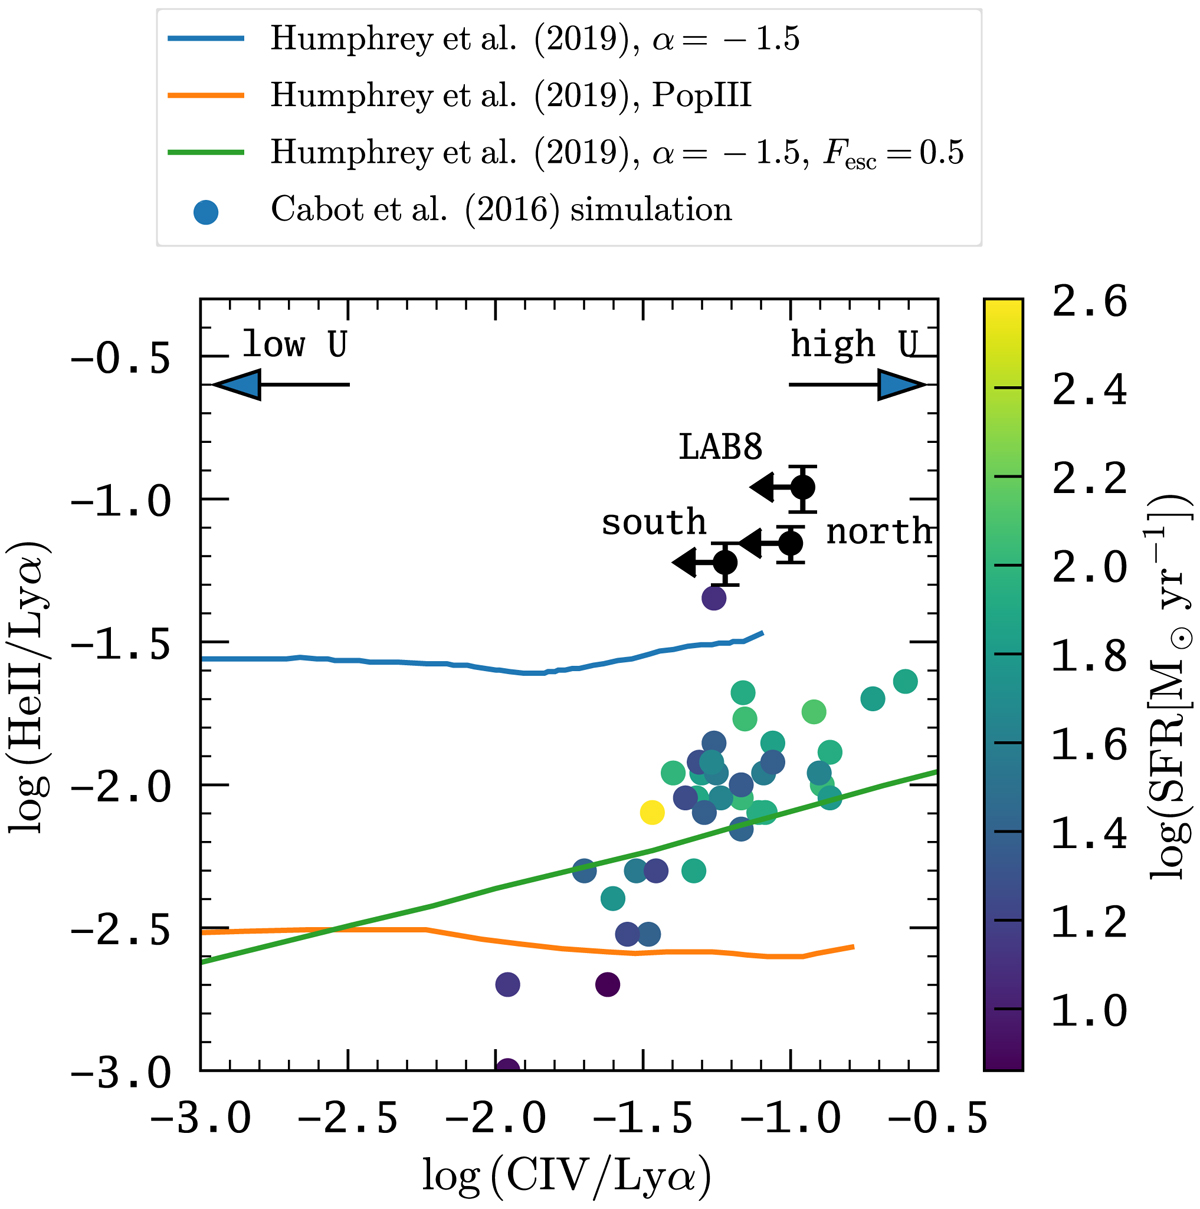
Measured He II/Lyα ratios vs. upper limits on C IV/Lyα ratios for the three He II emitting regions in LAB 1 compared to hydrodynamic simulations from Cabot et al. (2016) and tracks of photo-ionisation models by Humphrey et al. (2019). The individual simulated LABs from Cabot et al. (2016) are colour-coded according to the star-formation rate of the galaxies within the LAB hosting halos. The Humphrey et al. (2019) photo-ionisation models are computed for low metallicity (Z = 0.01Z⊙) low-density gas in the circum-galactic medium of AGN host-galaxies (blue and green curve – see text) or Pop-III star-forming galaxies (orange curve). For the photo-ionisation models the ionisation parameter varies from U = 0.25 for the highest C IV/Lyα ratios to U ≈ −2.5 where C IV/Lyα = −3.
Current usage metrics show cumulative count of Article Views (full-text article views including HTML views, PDF and ePub downloads, according to the available data) and Abstracts Views on Vision4Press platform.
Data correspond to usage on the plateform after 2015. The current usage metrics is available 48-96 hours after online publication and is updated daily on week days.
Initial download of the metrics may take a while.