Fig. 13.
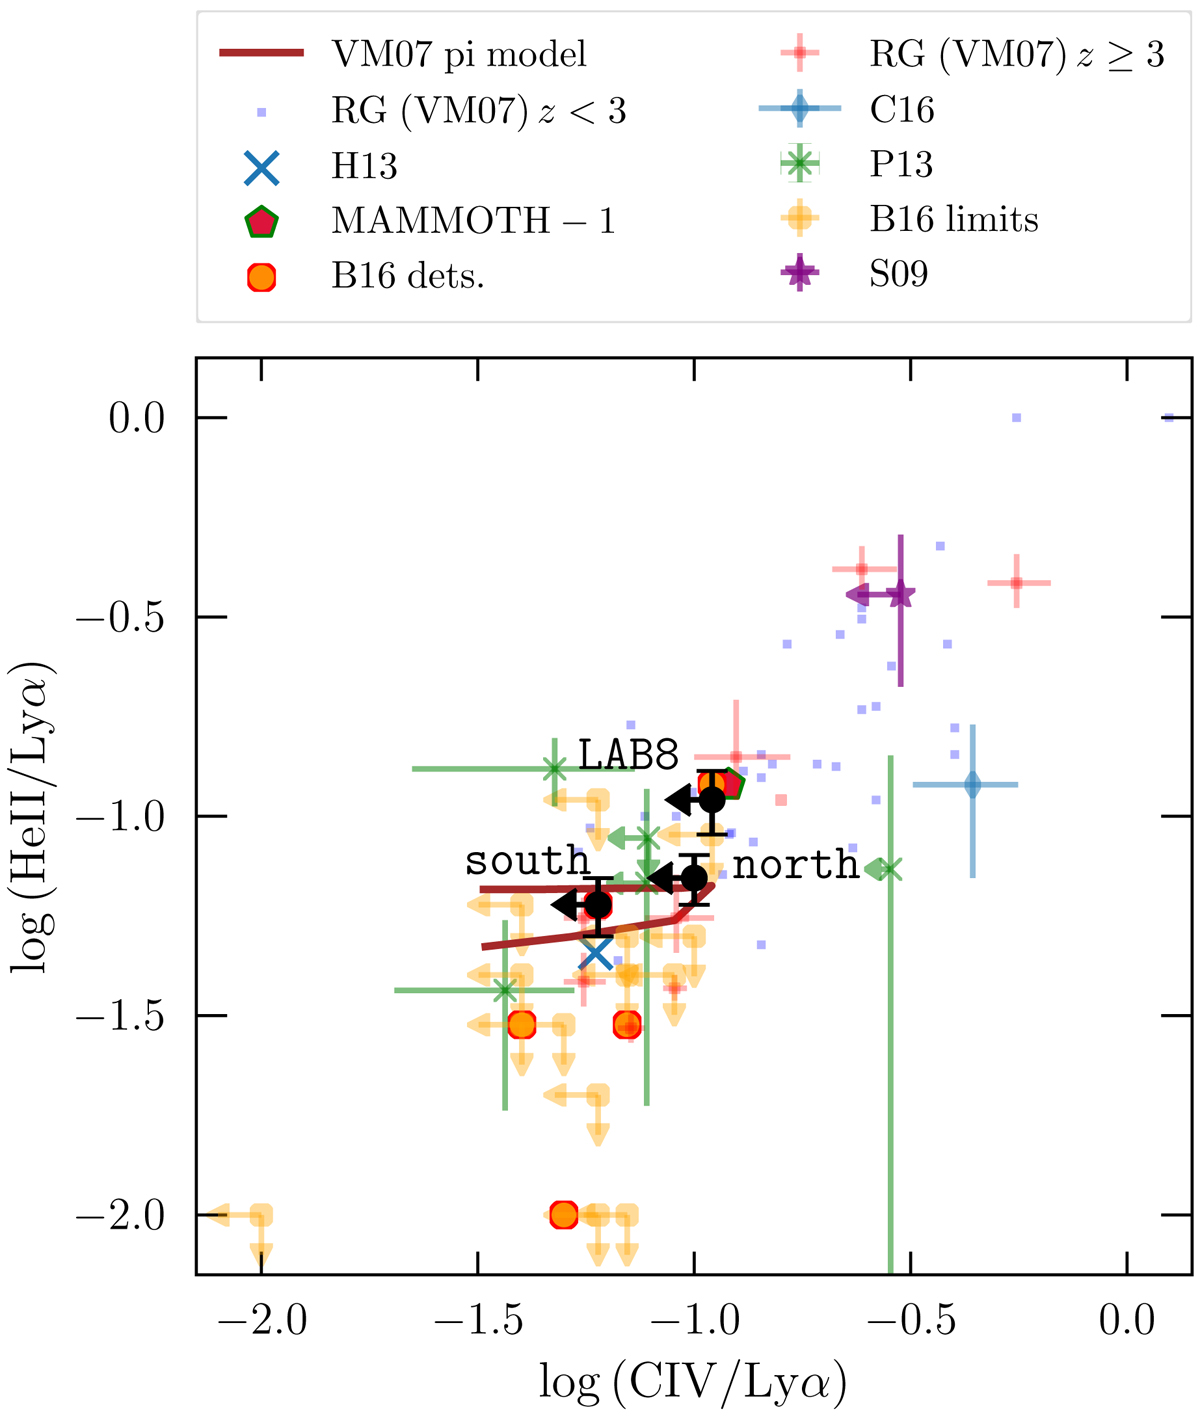
Measured He II/Lyα ratios vs. upper limits on C IV/Lyα ratios for the three regions where we detect He II emission in the LAB (individually labelled black circles and error bars) in comparison to ratios or upper limits seen in other high-z sources with extended Lyα nebulae. The comparison includes the following objects from the literature: 61 high-z radio galaxies (labelled RG in the legend, with different symbols for the z < 3 and z ≥ 3 sources) from the compilation by Villar-Martín et al. (2007a); 17 radio-quiet quasars and two radio-loud z ∼ 3 quasars (labelled B16 – mostly upper limits in He II and C IV with only four sources with C IV detections, and with the two highest C IV/Lyα ratios coming from the radio-loud quasars) by Borisova et al. (2016); five extended 2 ≲ z ≲ 3 Lyα nebulae found in a blind broad-band search (labelled P13) from Prescott et al. (2013); the extreme Lyα nebulae around a z = 2.3 quasar MAMMOTH-1 from Cai et al. (2017); a z = 2.3 LAB from Scarlata et al. (2009a) that is detected only in He II (labelled S09); a faint (≈1042 erg s−1) extended nebulae found behind a gravitational lens (labelled C16) by Caminha et al. (2016); and an extended line emitting nebulae around a z = 2.5 radio-loud quasar (labelled H13) from Humphrey et al. (2013). We also show a track of a photo-ionisation model with varying ionisation parameter by Villar-Martín et al. (2007a) for a power-law spectral energy distribution with nH = 100 cm−3 and solar metallicity (labelled VM07 pi model – see text for details).
Current usage metrics show cumulative count of Article Views (full-text article views including HTML views, PDF and ePub downloads, according to the available data) and Abstracts Views on Vision4Press platform.
Data correspond to usage on the plateform after 2015. The current usage metrics is available 48-96 hours after online publication and is updated daily on week days.
Initial download of the metrics may take a while.