Fig. 12.
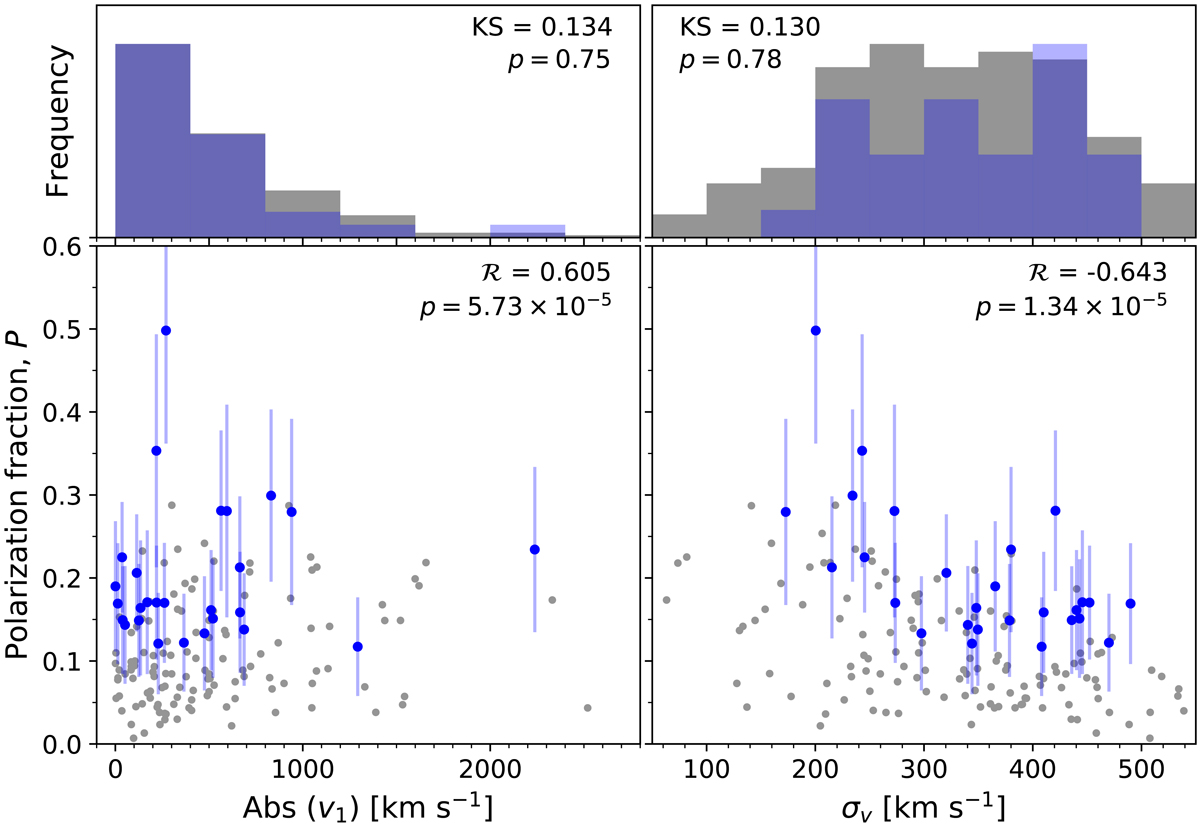
Region-by-region comparison of the polarisation fraction (P) derived from VLT/FORS2 observations, with the kinematic measurements of the Lyα emission derived in this paper. Left panel: P against the absolute value of the first moment (Eq. (7)), right panel: P against the second moment (Eq. (8)). Gray points show every spatial element for which P could be measured at better than 5 per cent (see Fig. 2 of Hayes et al. 2011). Blue points show the regions in which P is detected at significance better than 2-σ. Spearman’s rank correlation coefficient, ℛ, and the associated p-value (the likelihood with which a correlation of at least this magnitude arises purely by chance) are shown in each figure – p < 0.05 is generally considered significant. The histograms above each plot shows the distribution of properties from the lower abscissae, where the grey and blue colouring follows that of the lower figures. The values from the two-sample KS-statistic, and the associated p-value, are presented in each panel. These p-values of almost 1 show that the polarised spaxels are consistent with being drawn from the same distribution, and that the trends seen in the blue points of the lower figures are not the result of biased selection.
Current usage metrics show cumulative count of Article Views (full-text article views including HTML views, PDF and ePub downloads, according to the available data) and Abstracts Views on Vision4Press platform.
Data correspond to usage on the plateform after 2015. The current usage metrics is available 48-96 hours after online publication and is updated daily on week days.
Initial download of the metrics may take a while.