Fig. 11.
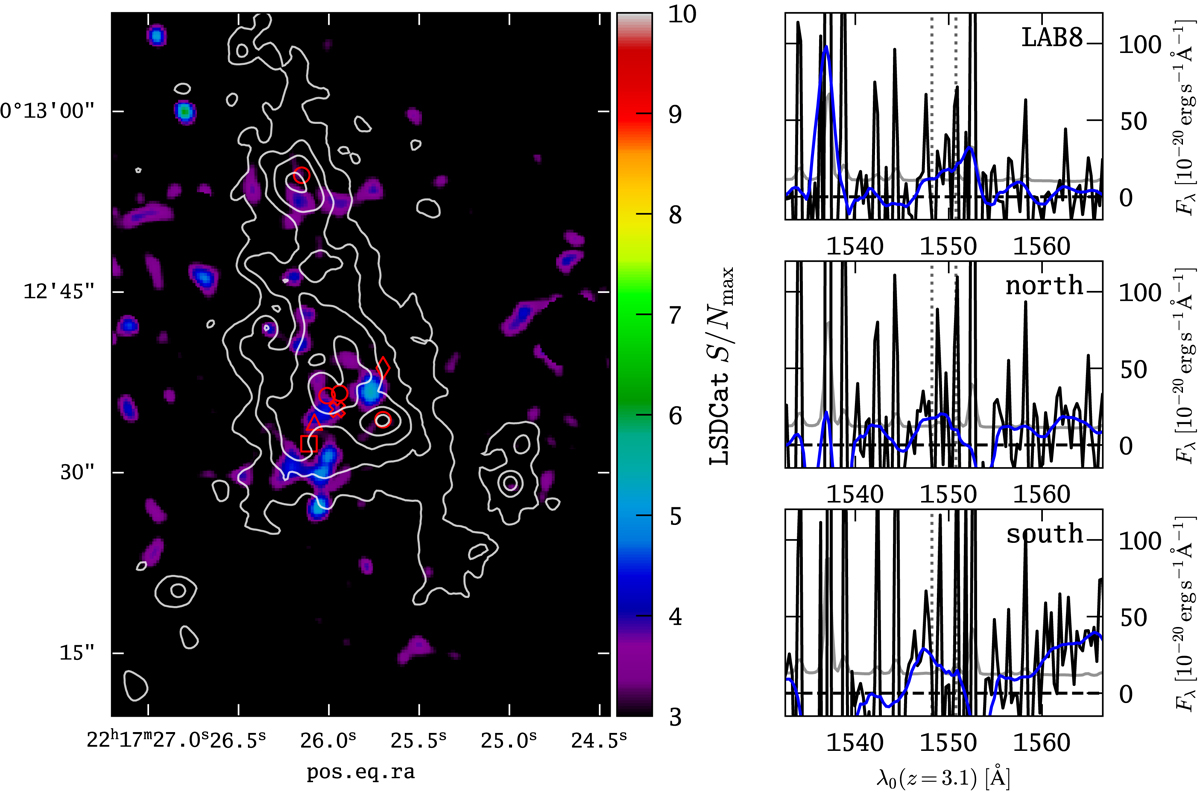
Non-detection of significant signal from C IV emission within LAB 1. Left panel: maximum S/N after cross-correlation with a 3D Gaussian template (see Sect. 5.2). Here the S/N cube was evaluated between λmin = 6345 Å and λmax = 6360 Å. Right panels: spectral extractions in the regions “south”, “north”, and “LAB 8”, where significant He II emission was detected (Fig. 10). In each of those panels, the black curve shows the extracted spectrum, while the grey curve shows the propagated noise from the variance datacube. Vertical dotted lines indicate the rest-frame wavelengths of the C IV doublet. We also show a smoothed version (Gaussian window, σ = 3 px) of the spectrum (blue curve), which suppresses the high-frequency and high-amplitude oscillations from systematic sky-subtraction residuals in this wavelength range.
Current usage metrics show cumulative count of Article Views (full-text article views including HTML views, PDF and ePub downloads, according to the available data) and Abstracts Views on Vision4Press platform.
Data correspond to usage on the plateform after 2015. The current usage metrics is available 48-96 hours after online publication and is updated daily on week days.
Initial download of the metrics may take a while.