Fig. 10.
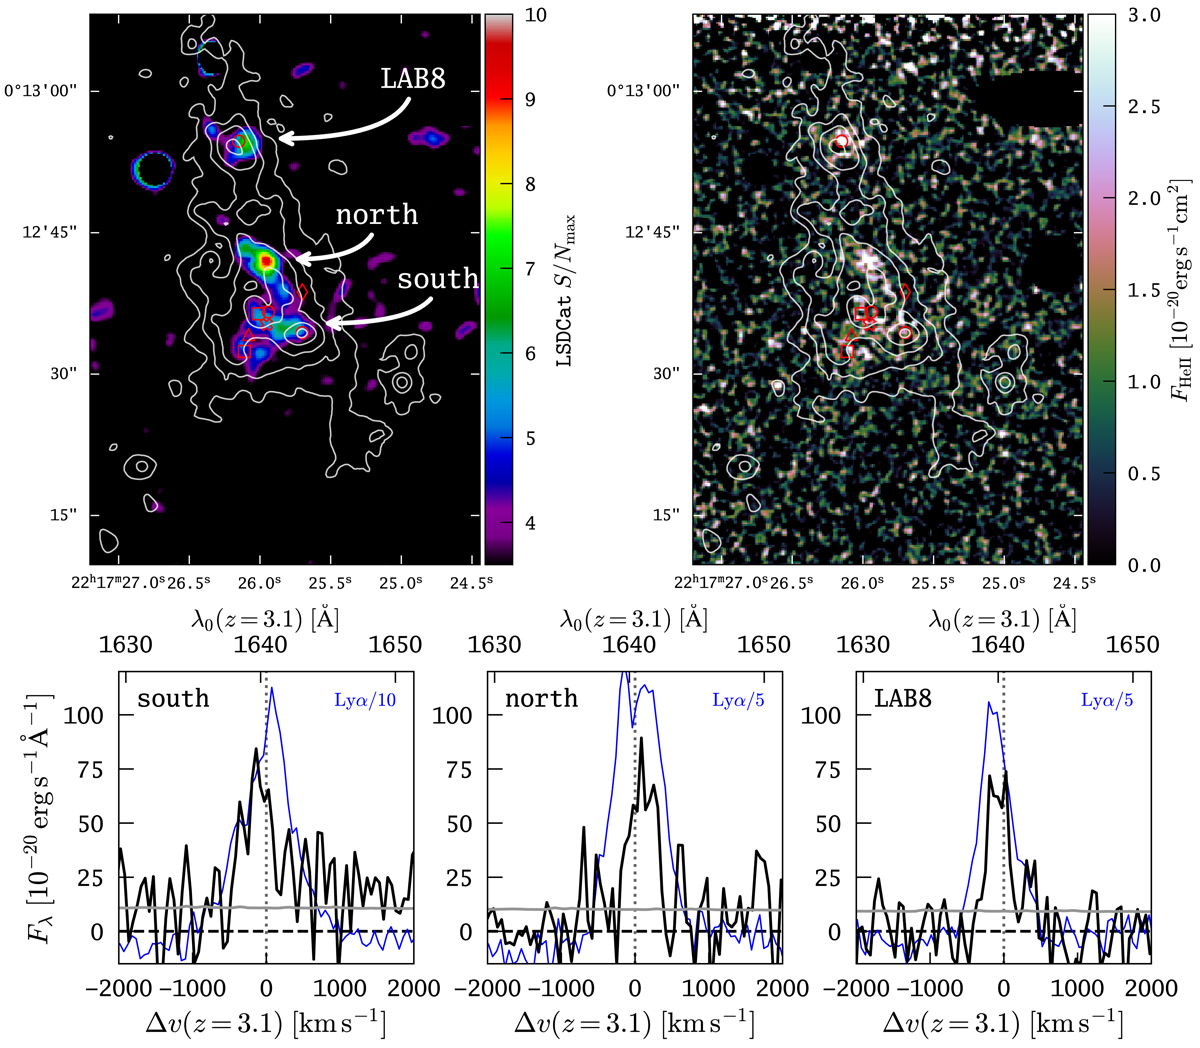
Detection of extended He IIλ1640 fuzz in three distinct regions within LAB 1. Top left: map of the maximal He II S/N after cross-correlation with a 3D Gaussian template (see Sect. 5.2). We show the maximum from the S/N datacube between λmin = 6719 Å and λmax = 6729 Å (i.e. ±5 Å around He II at z = 3.1). We label the three He II emitting regions “south”, “north”, and “LAB8” as indicated. Top right: adaptive He II narrow-band image. The creation of this image followed a similar procedure as for the adaptive Lyα narrow-band image (see Fig. 5 and Sect. 5.2), except that here, the adopted S/N analysis threshold is three, and the default band-width for non-detections above this threshold is set to three datacube layers. The adaptive narrow-band image was additionally smoothed with a σ = 1 px (0.2″) Gaussian kernel. Grey contours indicate Lyα surface-brightness levels SBLyα = [200, 100, 50, 25, 8.75] × 10−19 erg s−1 cm−2 arcsec−2 as measured in the adaptive narrow-band image (Fig. 5). In addition to the foreground galaxies in the west, where bright continuum-emission corroborated the median-filter subtraction continuum removal, we also masked out O III line emission from a z = 0.3 galaxy (at the northern edge of the image), and Hβ emission from a z = 0.4 galaxy (at the north-western edge of the image), as these highly significant emission lines coincide with the z = 3.1 He II emission. Bottom panels: He II spectral profiles extracted from the three regions “south” (bottom left panel), “north” (bottom centre panel), and “LAB 8” (bottom right panel). The black line is the spectrum and the grey line shows the propagated error from the variance cube. The bottom axis is given in velocities and the top axis indicates rest-frame wavelength, both for z = 3.1. The vertical dotted line indicates the rest-frame wavelength of He II (1640.42 Å). Extraction was performed by defining apertures connected regions of pixels above a S/N threshold of 6 in the maximum S/N map. For comparison we also show the Lyα profiles scaled by a factor of 10 (5) for the “south” (“north” and “LAB8”) regions as blue lines (for those profiles, only the bottom velocity axis is relevant).
Current usage metrics show cumulative count of Article Views (full-text article views including HTML views, PDF and ePub downloads, according to the available data) and Abstracts Views on Vision4Press platform.
Data correspond to usage on the plateform after 2015. The current usage metrics is available 48-96 hours after online publication and is updated daily on week days.
Initial download of the metrics may take a while.