Fig. 1.
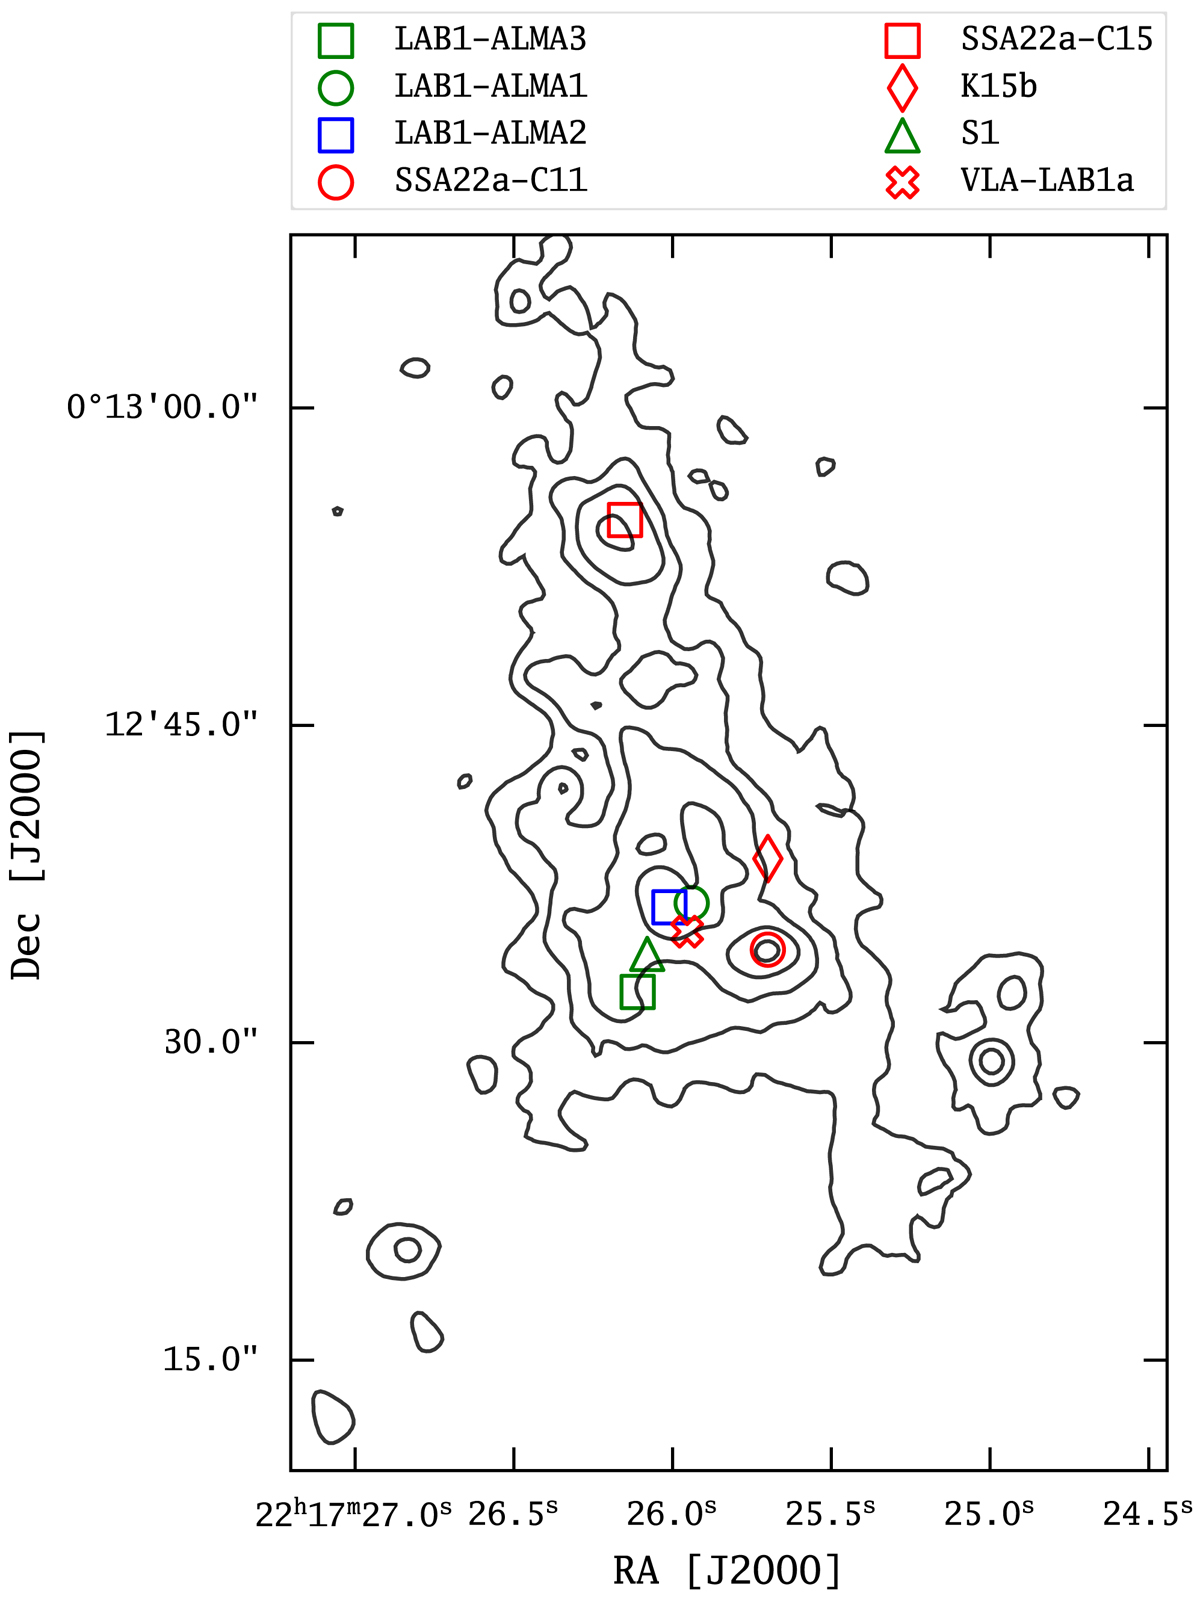
Positions of confirmed galaxies within the LAB 1/LAB 8 structure (Table 1) shown alongside Lyα surface brightness contours from our MUSE adaptive narrow band image (see Sect. 5.2). The red circle and red square mark the Lyman Break Galaxies SSA22a-C11 and SSA22a-C15 from Steidel et al. (2003), respectively. The green circle and blue square mark the ALMA 850 μm detections LAB1-ALMA1 and LAB1-ALMA2 (Geach et al. 2016; Umehata et al. 2017), respectively. The red cross marks the position of the 3 GHz radio-continuum detection VLA-LAB1a (Ao et al. 2017). The red diamond indicates the K-band selected and spectroscopically confirmed galaxy LAB01-K15b from Kubo et al. (2015, 2016). The green square marks the ALMA 850 μm plus [C II] 158 μm detected source (Geach et al. 2016; Umehata et al. 2017). This source is also detected at 3 GHz with the VLA (S10 cm = 7.3 μJy; Ao et al. 2017) and it has a tentative X-Ray counterpart in the 400 ks deep Chandra data from Lehmer et al. (2009b). The serendipitously found z = 3.1 [O III] emitter S1 from Geach et al. (2016) is marked with a green triangle. The symbols used to indicate the embedded galaxies within the blob is used throughout the paper. North is to the top and east is to the left. The contours correspond to Lyα surface-brightness levels SBLyα = [200, 100, 50, 25, 8.75] × 10−19 erg s−1 cm−2 arcsec−2.
Current usage metrics show cumulative count of Article Views (full-text article views including HTML views, PDF and ePub downloads, according to the available data) and Abstracts Views on Vision4Press platform.
Data correspond to usage on the plateform after 2015. The current usage metrics is available 48-96 hours after online publication and is updated daily on week days.
Initial download of the metrics may take a while.