Fig. B.2
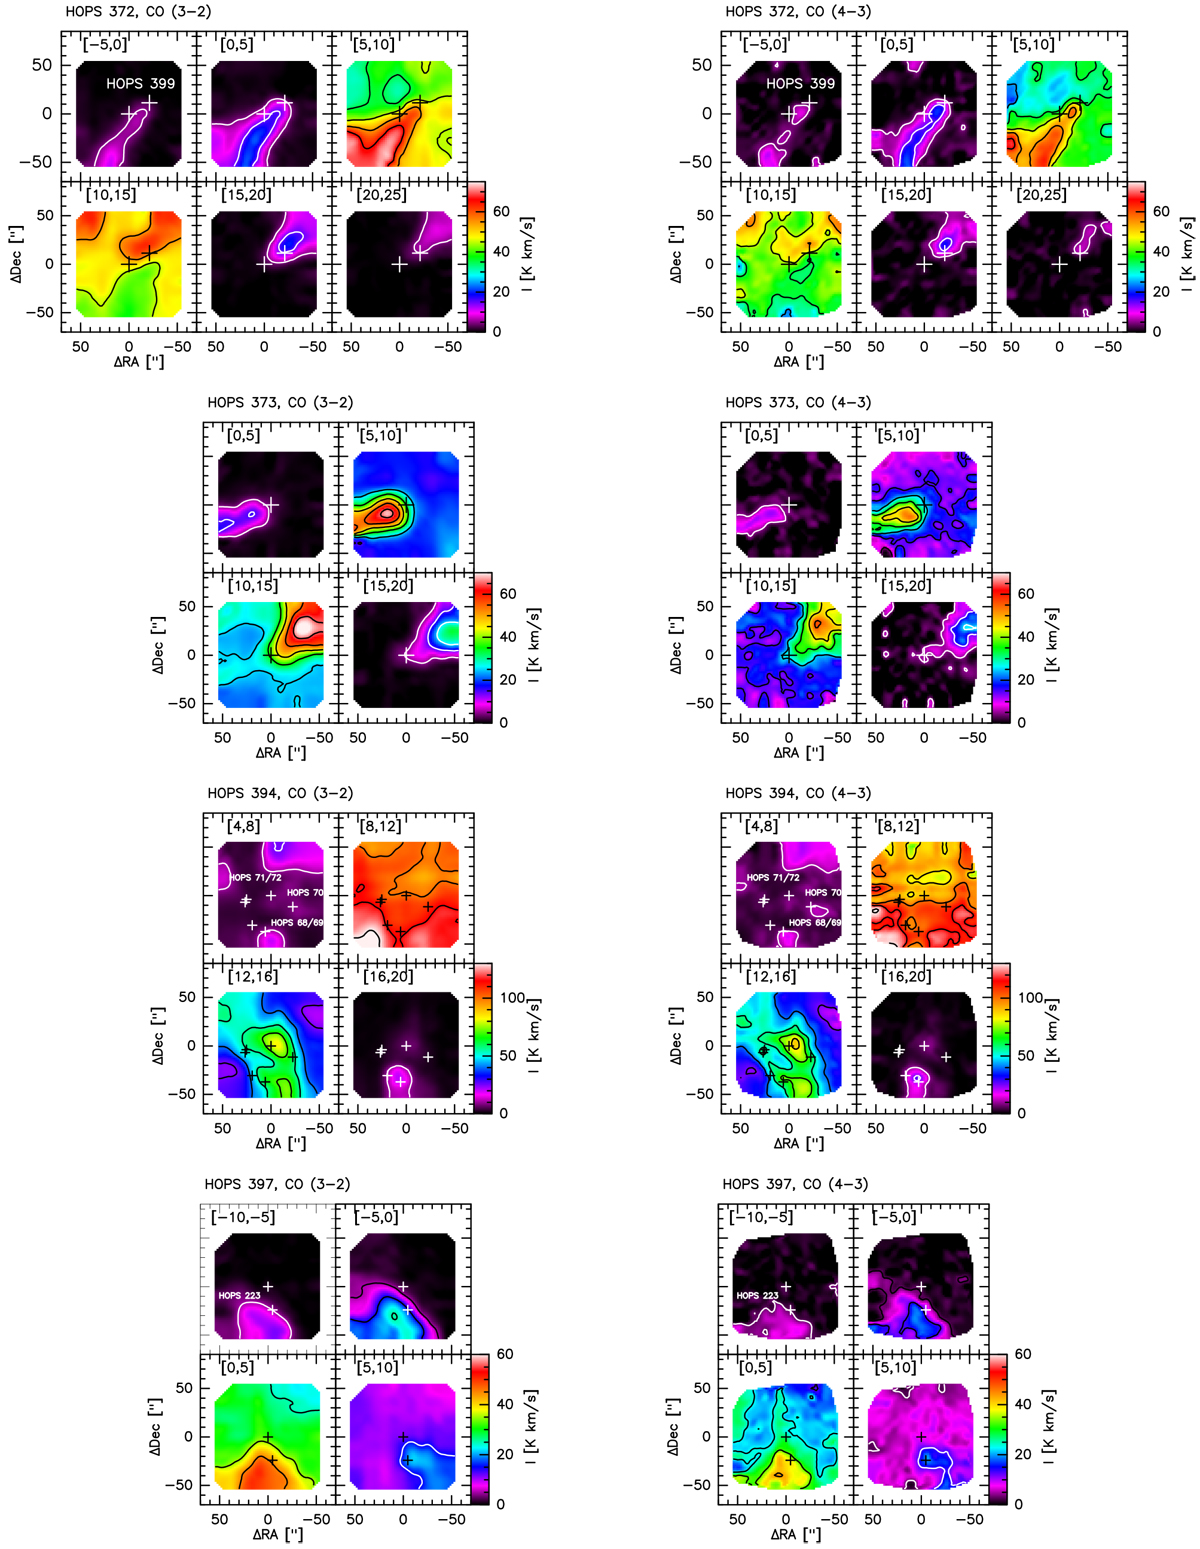
Intensity maps centered on HOPS 372, HOPS 373, HOPS 394, and HOPS 397 integrated over the velocity ranges shown in the upper-left corner of each subfigure. Contour levels: between 5 and 75 K km s−1 at intervals of 10 K km s−1 for both CO J = 3–2 and J = 4-3 for HOPS 372 and HOPS 373, between 10 and 130 K km s−1 at intervals of 15 K km s−1 for HOPS 394 CO J = 3–2 and J = 4–3, between 5 and 60 K km s−1 at intervals of 10 K km s−1 for HOPS 397 CO J = 3–2, between 3 and 60 K km s−1 at intervals of 10 K km s−1 for HOPS 397 CO J = 4–3.
Current usage metrics show cumulative count of Article Views (full-text article views including HTML views, PDF and ePub downloads, according to the available data) and Abstracts Views on Vision4Press platform.
Data correspond to usage on the plateform after 2015. The current usage metrics is available 48-96 hours after online publication and is updated daily on week days.
Initial download of the metrics may take a while.