Fig. 4
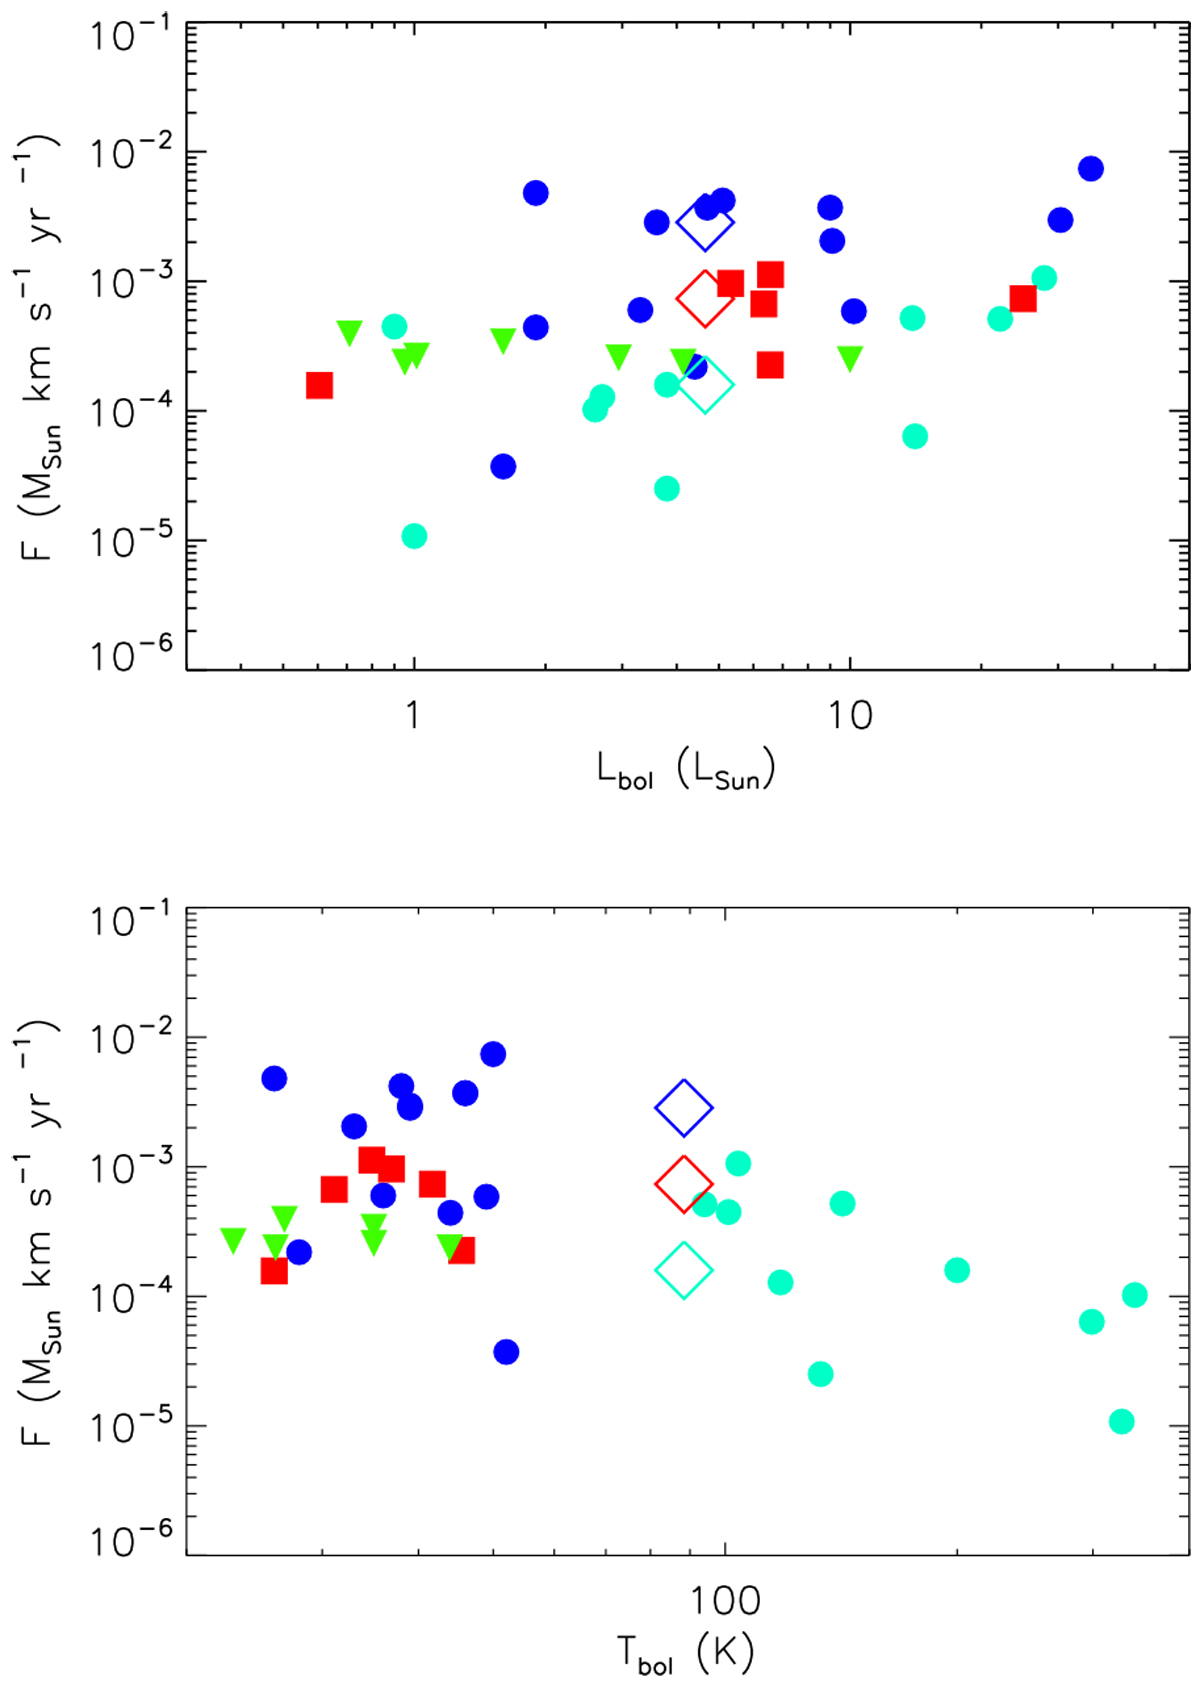
Outflow forces (for the combined blue and red outflow lobes) (M⊙ km s−1 yr−1) versus Lbol (L⊙) (top panel) and Tbol (K) (bottom panel) calculated using the CO J = 3–2 transition and assuming an excitation temperature of 75 K for the PBRs analyzed in this paper (red squares). The Class 0 source HOPS 340 and Class I source HOPS 223 are not shown. The outflow forces calculated using the same transition and excitation temperature by Yildiz et al. (2015) for a sample of Class 0 protostars (blue circles) and Class I protostars (cyan circles). The green triangles are the 1-σ upper limits for the PBRs with no detected outflow emission. The diamonds represent the median values of each sample: Class 0 protostars from Yildiz et al. (2015) (blue), Class I protostars from Yildiz et al. (2015) (cyan), and the protostars studied in this paper (red).
Current usage metrics show cumulative count of Article Views (full-text article views including HTML views, PDF and ePub downloads, according to the available data) and Abstracts Views on Vision4Press platform.
Data correspond to usage on the plateform after 2015. The current usage metrics is available 48-96 hours after online publication and is updated daily on week days.
Initial download of the metrics may take a while.