Fig. C.2
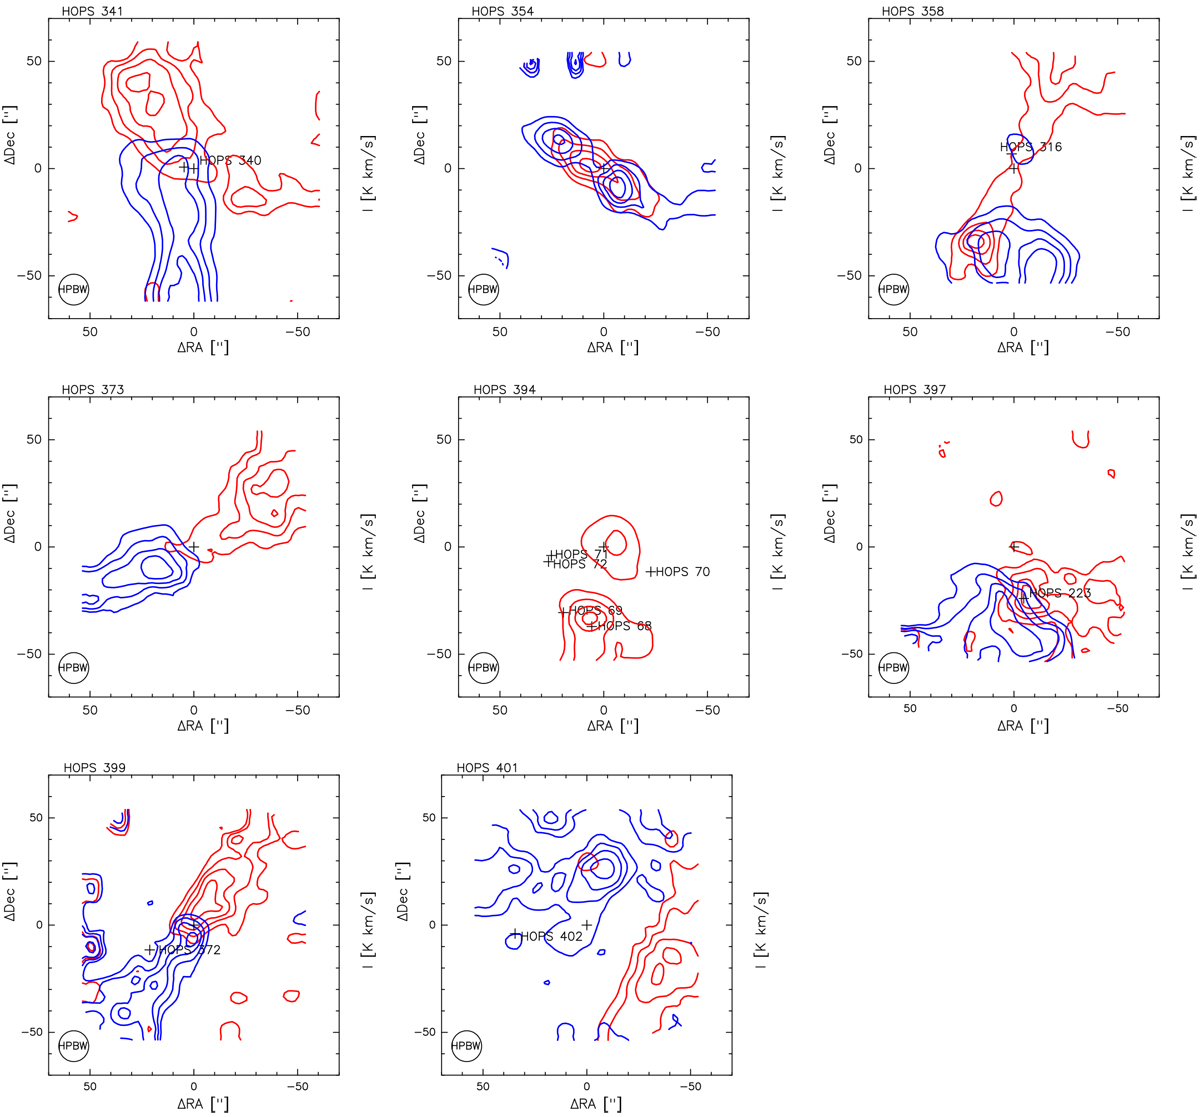
CO J = 4–3 integrated intensities of the blue- and red-shifted outflows (blue and red contours) for the sources with clear outflow detections. The integration limits are listed in Table 2. The contours are 30%, 50%, 70%, and 90% of the maximum values of the intensities corresponding to the red- and blue-shifted outflow lobes in TMB units towardthe different maps, which are: 19.8 K km s−1 (red) and 63.6 K km s−1 (blue) toward HOPS 341, 31.2 K km s−1 (red) and 21.5 K km s−1 (blue) toward HOPS 354, 48.8 K km s−1 (red) and 46.7 K km s−1 (blue) toward HOPS 358, 42.4 K km s−1 (red) and 39.8 K km s−1 (blue) for HOPS 373, 56.0 K km s−1 (red) for HOPS 394, 14.3 K km s−1 (red) and 32.5 K km s−1 (blue) for HOPS 397, 29.5 K km s−1 (red) and 34.1 K km s−1 (blue) for HOPS 399, and 34.7 K km s−1 (red) and 13.8 K km s−1 (blue) for HOPS 401.
Current usage metrics show cumulative count of Article Views (full-text article views including HTML views, PDF and ePub downloads, according to the available data) and Abstracts Views on Vision4Press platform.
Data correspond to usage on the plateform after 2015. The current usage metrics is available 48-96 hours after online publication and is updated daily on week days.
Initial download of the metrics may take a while.