Fig. 1
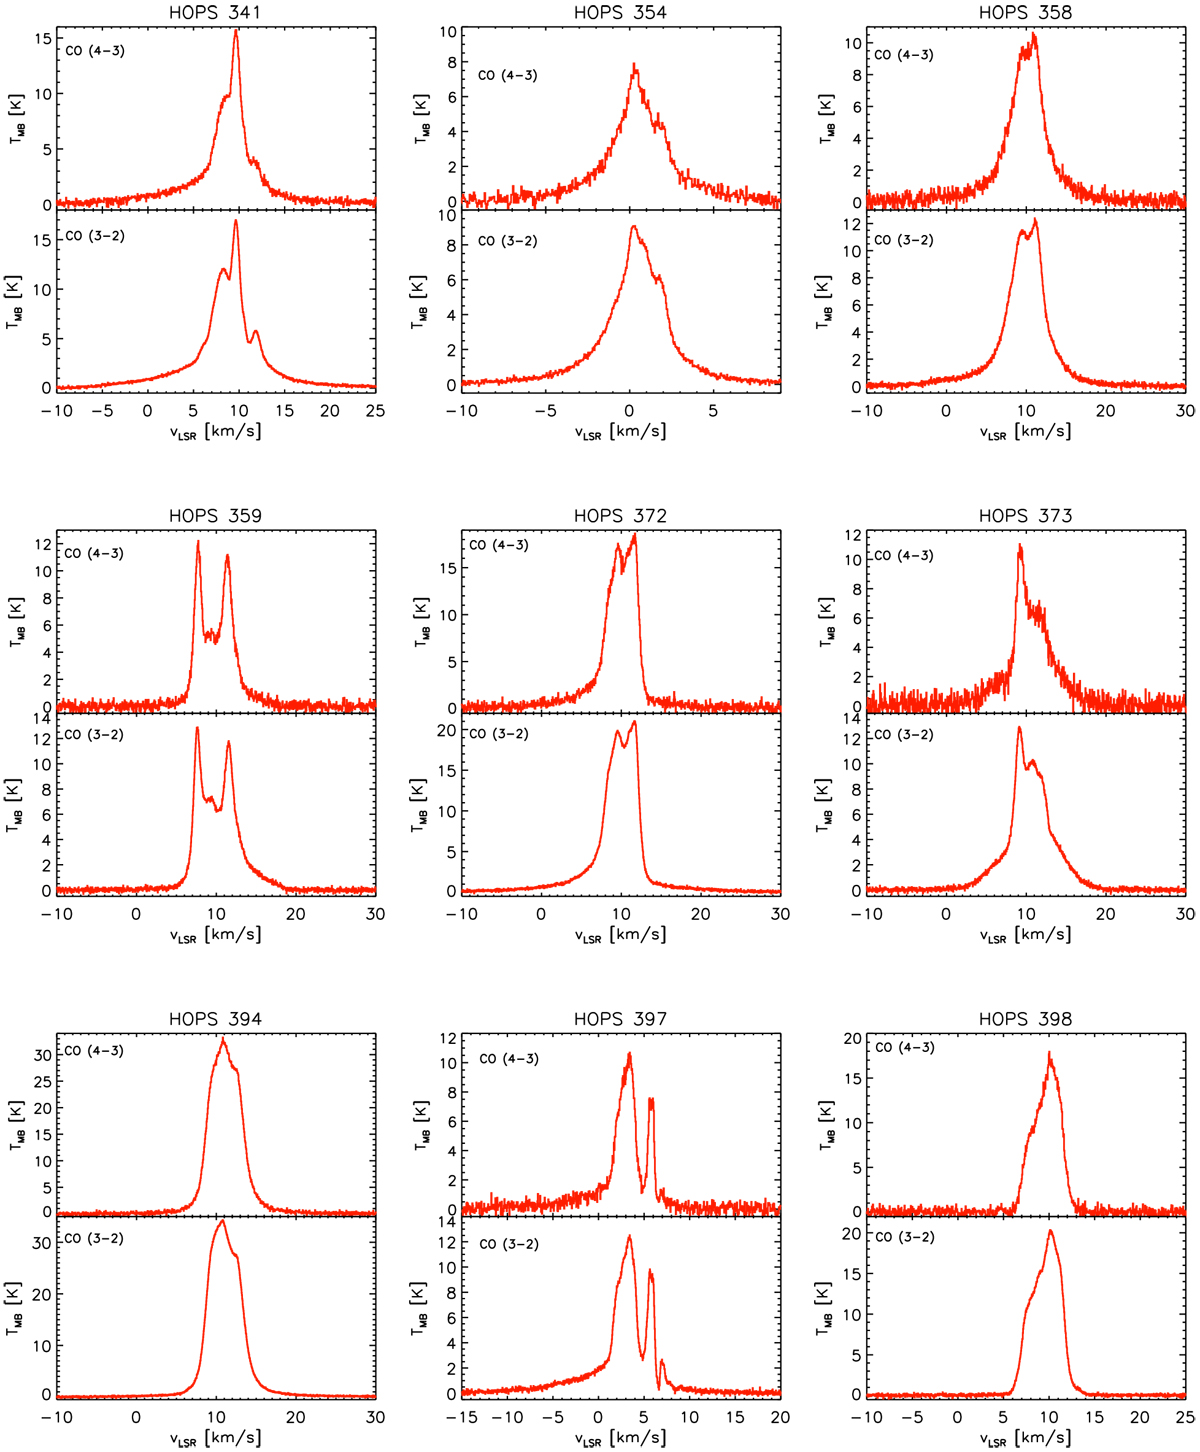
CO J = 3–2 and CO J = 4–3 line profiles averaged over the maps. The source mentioned for each figure is the center of the maps. The outflow emission detected toward HOPS 341 likely corresponds to the Class 0 protostar HOPS 340. The line wings detected toward HOPS 372 and HOPS 399 are from the same outflow, attributed to HOPS 399. The outflow toward the HOPS 397 map is dominated by the Class I protostar HOPS 223.
Current usage metrics show cumulative count of Article Views (full-text article views including HTML views, PDF and ePub downloads, according to the available data) and Abstracts Views on Vision4Press platform.
Data correspond to usage on the plateform after 2015. The current usage metrics is available 48-96 hours after online publication and is updated daily on week days.
Initial download of the metrics may take a while.