| Issue |
A&A
Volume 642, October 2020
|
|
|---|---|---|
| Article Number | A40 | |
| Number of page(s) | 18 | |
| Section | Extragalactic astronomy | |
| DOI | https://doi.org/10.1051/0004-6361/201937142 | |
| Published online | 02 October 2020 | |
“Observations” of simulated dwarf galaxies
Star-formation histories from color-magnitude diagrams
1
Department of Physics and Astronomy, Ghent University, Krijgslaan 281, 9000 Ghent, Belgium
e-mail: shivangee.rathi@ugent.be
2
Université Côte d’Azur, OCA, CNRS, 06304 Nice, Lagrange, France
3
Institute for Computational Science, University of Zürich, Winterthurerstrasse 190, 8057 Zürich, Switzerland
4
Instituto de Astrofísica de Canarias, 38200 La Laguna, Tenerife, Spain
Received:
19
November
2019
Accepted:
15
July
2020
Context. Apparent deviations between properties of dwarf galaxies from observations and simulations are known to exist, such as the “Missing Dwarfs” problem, the too-big-to-fail problem, and the cusp-core problem, to name a few. Recent studies have shown that these issues can at least be partially resolved by taking into account the systematic differences between simulations and observations.
Aims. This work aims to investigate and address any systematic differences affecting the comparison of simulations with observations.
Methods. To this aim, we analyzed a set of 24 realistically simulated Models of Realistic dwarfs In Action (MoRIA) dwarf galaxies in an observationally motivated way. We first constructed “observed” color-magnitude diagrams (CMDs) of the simulated dwarf galaxies in the typically used V- and I-bands. Then we used the synthetic CMD-fitting method to recover their star-formation histories (SFHs) from their observed CMDs. These solved SFHs were then directly compared to the true SFHs from the simulation star-particle data, mainly in terms of the star-formation rate (SFR) and the age-metallicity relation (AMR). We also applied a dust extinction prescription to the simulation data to produce observed CMDs affected by dust in the star-forming regions. Since future facilities, such as the James Webb Space Telescope and the European Extremely Large Telescope, will focus on the (near)-infrared rather than the optical, we also constructed and analyzed CMDs consisting of the I- and H- bands.
Results. We find a very good agreement between the recovered and the true SFHs of all the simulated dwarf galaxies in our sample, from the synthetic CMD analysis of their V − I versus I as well as the I − H versus H CMDs. Dust leads to an underestimation of the SFR during the last few hundred million years, with the strength and duration of the effect dependent on the dust content. Overall, our analysis indicates that quantities like SFR and AMR derived from the photometric observations of galaxies are directly comparable to their simulated counterparts, thus eliminating any systematic bias in the comparison of simulations and observations.
Key words: galaxies: dwarf / galaxies: star formation / galaxies: evolution / Hertzsprung–Russell and C–M diagrams
© ESO 2020
1. Introduction
Dwarf galaxies are the smallest and the most abundant type of galaxies in the Universe (Ferguson & Binggeli 1994). Being low-mass systems, they are more susceptible to the astrophysical processes that drive galaxy evolution than the massive galaxies and therefore serve as ideal systems to study the effect of these processes on their evolution. Numerical simulations based on the currently accepted Λ-cold dark matter (ΛCDM) cosmological model (Planck Collaboration XIII 2016), equipped with sub-grid models that heuristically describe the gas-star interactions, are now able to provide predictions for the structural, dynamical, and stellar populations properties of dwarf galaxies across different galactic environments (Schroyen et al. 2011; Revaz & Jablonka 2012; Shen et al. 2014; Cloet-Osselaer et al. 2014; Schaller et al. 2015; Snyder et al. 2015; Wang et al. 2015; Verbeke et al. 2015, 2017; hereafter referred to as V15 and V17, respectively, and Fattahi et al. 2018).
A number of apparent mismatches between these predictions and the observations have challenged our understanding of (dwarf) galaxy formation and evolution. Two of the most notable issues are the intimately linked “Missing Dwarfs” problem and the so-called too-big-to-fail (TBTF) problem. The former is the mismatch between the predicted distribution of dwarf-sized dark-matter halos over circular velocity and the observed distribution of Local Group dwarf galaxies over rotation velocity (Kauffmann et al. 1993; Klypin et al. 1999; Moore et al. 1999). The TBTF problem is the inability of simulations to reproduce the observed number densities of dwarf galaxies and their internal kinematics, both in the Local Group (Boylan-Kolchin et al. 2011) and in the field (Papastergis & Shankar 2016), at the same time. Moreover, dark-matter-only simulations predict that dark-matter halos should have a centrally cusped density distribution, whereas observations of dwarf galaxy rotation curves seem to prefer cored central densities (see e.g., van den Bosch & Swaters (2001) and references therein). This is the cusp-core problem. Finally, we also wish to highlight the discrepancy between the observed and the predicted slope of the faint end of the (baryonic) Tully-Fisher relation (Sales et al. 2017).
Since the identification of these apparent shortcomings, it has become clear that some of them can be at least partly solved by a proper inclusion of baryonic physics in the simulations without abandoning the ΛCDM model of cosmic evolution. For instance, dark-matter cusps can be converted into cores by supernova induced gas motions (Cloet-Osselaer et al. 2012; Read et al. 2016) if enough stars are formed. Moreover, such outflows, and the dynamical response they elicit from the dark matter, also lower the maximum circular velocities of simulated dwarf galaxies, and this, in turn, alleviates the Missing Dwarfs and TBTF problems (Sawala et al. 2016) without fully solving them (Bullock & Boylan-Kolchin 2017).
It has been noted that systematic differences may exist between the quantities being compared between simulations and observations, leading to spurious mismatches between theory and observations. For instance, Papastergis & Shankar (2016) point out that the TBTF problem of the field dwarfs can be explained if the circular velocities derived from observed H I kinematics are systematically smaller than the actual circular velocities. Based on an analysis of the H I kinematics of simulated dwarfs from the MoRIA (Models of Realistic dwarfs In Action) suite using the same analysis codes also used by observers, V17 show that these simulated dwarfs display exactly the dependence between observed and actual circular velocities required to solve the TBTF of field dwarfs. Likewise, Pineda et al. (2017) show that the gas kinematics of simulated galaxies with centrally cusped dark-matter distribution, when analyzed in the same way as observed H I kinematics, would preferentially lead to the retrieval of a cored density distribution. In both cases, there is a marked difference between the circular velocity as derived from the gas kinematics (a quantity accessible by observations) and as derived from the mass distribution (a quantity only accessible by simulators).
With the available wealth of resolved photometric data of nearby Local Group dwarf galaxies, it has become possible to exploit their stellar CMDs to study their individual stellar populations and, in turn, to infer their star-formation histories (SFHs) (Monelli et al. 2010; Weisz et al. 2014; McQuinn et al. 2015; Aparicio et al. 2016; Skillman et al. 2017). This is obviously crucial to our understanding of their formation and evolution. As with the stellar and gaseous kinematics, it needs to be checked whether systematic differences exist between stellar population properties derived from simulations and observations.
In this paper, we continue our efforts in the direction of analyzing dwarf galaxy simulations in an observationally motivated way (V15, V17). Assuming simulations as the ground truth, we re-construct the SFHs of simulated dwarf galaxies from their CMDs using the synthetic CMD method (e.g., Tosi et al. 1991; Tolstoy & Saha 1996; Gallart et al. 1996; Dolphin 1997) used by observers, and see how these results compare to simulations.
This paper is organized as follows. In Sect. 2, we list the main features of the MoRIA simulations, which form the basis dataset of our study. Section 3 describes in detail the construction of realistic mock CMDs of simulated MoRIA dwarf galaxies from their simulation star-particle data. In Sect. 4, we give an outline of the implementation of the synthetic CMD method, starting from creating a synthetic CMD to the parameters crucial for the synthetic CMD method. In Sect. 5, we present and discuss the results based on the I versus V − I CMDs. In the subsequent section, we do the same for the I versus I − H CMDs. Lastly, we summarize and try to interpret our results in Sect. 6.
2. Simulations
We use the MoRIA suite of N-body/SPH simulations of late-type isolated dwarfs, presented in Verbeke et al. (2015), as the primary dataset for this work. The MoRIA are high resolution (mbar ∼ 103 M⊙) dwarf galaxy simulations performed with a modified version of the N-body/SPH-code GADGET-2 (Springel 2005). The added astrophysical ingredients include: radiative cooling, heating by the cosmic ultraviolet background radiation field, star formation, supernova and stellar feedback, and chemical enrichment including the Population-III stars1. More details on the MoRIA suite of simulations are available in De Rijcke et al. (2013), Cloet-Osselaer et al. (2014), Verbeke et al. (2015), Vandenbroucke et al. (2016), and V17.
In this paper, we observationally analyze a set of 24 simulated MoRIA dwarfs, with total stellar masses ranging between 106 M⊙–108 M⊙. Table 1 presents some of the important characteristics of the sample of MoRIA dwarfs under study. For brevity, we discuss the analysis of two representative simulations in the main body of the paper: DG-5, which has a star-formation rate (SFR) that rises with time, and DG-22, which formed most of its stars over ten billion years ago (see Table 1); we include the results of the other simulations in Appendix A. The following section details the construction of realistic CMDs from the simulation star-particle data.
Some basic properties of the MoRIA simulated dwarfs analyzed in this paper.
3. Constructing realistic color-magnitude diagrams
Color-magnitude diagrams are a widely used tool to study the stellar fossil records of nearby galaxies (Monelli et al. 2010; Rubele et al. 2011; Bernard et al. 2012, etc.). This approach is currently limited to the local Universe, for which resolved photometric data is accessible with the currently available instruments. With the future space telescopes, like the James Webb Space Telescope (JWST; Gardner et al. 2006), and upcoming ground-based facilities, like the Thirty Meter Telescope (Skidmore 2015), the Giant Magellan Telescope (Bernstein et al. 2014), and the European Extremely Large Telescope (E-ELT; Gilmozzi & Spyromilio 2007), it will become possible to observe the resolved stellar populations of galaxies outside the Local Group. This would open up new environments to study galaxy CMDs.
First, we present a method to make a realistic CMD for a simulated galaxy based on its simulation star-particle data. Codes that do exactly this have already been presented in the literature. For instance, Da Silva et al. (2012) present a fully stochastic code for synthetic photometry that incorporates effects due to clustering, cluster disruption, etc. However, we do not need to use the full might of such codes for our goals, nor do we want to because they introduce physical features that were not included in the original simulation. For our purposes, it is sufficient to sample individual stars from the stellar particles and obtain their photometric magnitudes from the closest matching isochrone in a stellar evolution library.
To obtain the CMD, we centered the snapshot on the center of mass of the star particles and rotated it in the face-on orientation. As a pre-selection step, we selected only the star particles lying within 1 kpc of the galaxy center and excluded the extremely metal-poor Population-III star particles (with [Fe/H] < −5). In addition to the star-particle data (i.e., a star particle’s mass, age, metallicity, and alpha abundance), we used two other ingredients to construct CMDs of simulated dwarf galaxies: (i) an initial mass function (IMF) and (ii) a stellar evolutionary library, or, more specifically, the stellar isochrones. We discuss these in more detail in the following sub-sections, followed by a detailed description of the steps involved in constructing a realistic “observed” CMD of a simulated galaxy. To avoid confusion, the terms “star particle” and “star” are used for a simulation star particle and an individual star, respectively.
3.1. Initial mass function
The dwarf galaxy simulations have star particles with known ages, masses, metallicities, and alpha-abundances. Each star particle is treated as a simple stellar population (SSP). From each star particle, we sampled several individual stars assuming that their distribution follows the Chabrier IMF (Chabrier 2003):
![$$ \begin{aligned} \frac{d\phi (m)}{dm} = {\left\{ \begin{array}{ll} \displaystyle \frac{ \exp [{-{A}^{2}(\log _{10}{m} + {B})^{2}}]}{m\ \mathrm{C} }&m \le 1\,{M_{\odot }} \\ \displaystyle m^{-2.3}&m > 1\,{M_{\odot }} \\ \end{array}\right.}, \end{aligned} $$](/articles/aa/full_html/2020/10/aa37142-19/aa37142-19-eq1.gif)
where A2 = 1.0502, B = 1.1024, and C = e−(AB)2. We sampled stars with masses between 0.1 M⊙ and 70 M⊙. Integrating the IMF in Eq. (1) within these stellar mass limits, and normalizing, gives:
where
![$$ \begin{aligned}&\Phi _{1}({M}) = {D\ [\ \mathrm{erf} (A (\log _{10}{M} +B)) - \mathrm{erf} (A(B-1))\ ]} \quad \text{ and}\\&\Phi _{2} ({M}) = \frac{1-{M}^{-1.3}}{1.3} \text{,} \quad \text{ with}\\&{D} = \frac{\sqrt{\pi }}{\mathrm{2AC} \log _{10}{e}} \text{,} \quad \mathrm{erf(x)} = \frac{2}{\sqrt{\pi }} \int \limits _{0}^{x} e^{-t^{2}}\,\mathrm{d}t,\ \text{ and}\ \\&{N} = \Phi _{1}(1) + \Phi _{2}(70). \end{aligned} $$](/articles/aa/full_html/2020/10/aa37142-19/aa37142-19-eq3.gif)
Inverting Eq. (2) gives the stellar mass as a function of normalized cumulative IMF, Φ:
![$$ \begin{aligned} M(\Phi ) = {\left\{ \begin{array}{ll} \displaystyle 10^{\{\mathrm{erfinv} \big [\frac{\Phi \ N}{\mathrm{D}} +\ \mathrm{erf}(A\ (B-1)) \big ] - {B}\} /{A}}&\Phi \le \Phi _{1}(1)\\ \displaystyle \big [ 1- 1.3\ ( N\ \Phi - \Phi _{1}(1)) \big ]^{-1/1.3}&\Phi > \Phi _{1}(1) \end{array}\right.}. \end{aligned} $$](/articles/aa/full_html/2020/10/aa37142-19/aa37142-19-eq4.gif)
Therefore, if we randomly draw numbers from [0,1) for the normalized quantity Φ(M), then, with the help of Eq. (3), we can sample the masses (M) of the individual stars from a star particle until the total mass of the star particle is reached. However, the mass of the star particle is never sampled exactly, and, in the present work, we allowed for over-sampling by one star. This is similar to the “stop after” sampling discussed in Haas & Anders (2010), where it is discussed in the context of sampling stars from a star cluster. This over-sampling by one star results in an error, which is the difference between the actual mass of the star particle and the total mass of the stars sampled from it. We find a maximum over-sampling error of 0.12% of the total mass of all star particles. Figure 1 shows the distribution of all the sampled stars for the simulated galaxy DG-5 in panel a and its cumulative in panel b, compared to their analytical forms given by Eqs. (1) and (2), respectively.
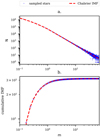 |
Fig. 1. Mass distribution of the sampled stars of the simulated dwarf galaxy DG-5 based on the method described in Sect. 3.1. Panel a: Chabrier IMF described by Eq. (1) and panel b: cumulative IMF given by Eq. (2). The sampled distributions are represented by blue circles and the analytical functions are shown by the dashed red lines. |
3.2. Stellar evolution library
Once all the star particles are sampled into individual stars, with the knowledge of a star’s mass, age, metallicity, and alpha-abundance, derive its photometric magnitudes with the help of the stellar evolution libraries. In particular, we used the BaSTI (Bag of Stellar Tracks and Isochrones)2 stellar evolution library to obtain the V- and I-band magnitudes of the sampled stars to construct their typically used V − I versus I CMDs. The sampled stars cover a broad range of masses (0.1 M⊙–70 M⊙); therefore, to cover the maximum range of masses of the sampled stars, we used a combination of two complementary stellar evolution models (canonical) within BaSTI: (i) the “standard model” (Pietrinferni et al. 2004, 2006, 2013) and (ii) the model extending to the very-low-mass (VLM) stars (based on Cassisi et al. 2000).
The standard model comprises both scaled-solar and alpha-enhanced asymptotic giant branch (AGB) extended isochrones with an AGB mass loss efficiency parameter, η = 0.4. The isochrones in the standard model follow the stellar evolution from the pre-main sequence to the early-AGB phase. They cover a range in mass from 0.5 M⊙ to 10 M⊙, while covering a broad range in metallicity 10−5 ≤ Z ≤ 0.05.
On the other hand, the VLM model, as the name suggests, covers the low-mass end of the sampled stars. The VLM model has the scaled-solar isochrones with an AGB mass loss efficiency parameter, η = 0.4. The isochrones in the VLM model cover the hydrogen-burning stars going from the faint end of the main sequence up to the main sequence turnoff. They extend to VLM stars with masses down to 0.1 M⊙ (and up to 2 M⊙) and cover metallicities in the range 2 × 10⁻⁴ ≤ Z ≤ 2 × 10⁻³. Both models cover a range in age from 0.03 Gyr to 14 Gyr.
For each of the star particles of a simulated galaxy, based on the age, metallicity, and alpha-abundance of the star particle, a best matching isochrone was selected from the broad range of isochrones described above. In the cases where the star particle lies beyond the age-metallicity bounds of the set of available isochrones, such as the few extremely metal-rich (Z > 0.03) and/or very young star particles, the closest limiting isochrone was chosen. For example, a young metal-rich star with Z ≥ 0.05 and age ≤ 0.03 Gyr will be approximated by the closest available isochrone with Z = 0.03 and age = 0.03 Gyr. Now, based on the mass of a sampled star, its photometric magnitude was derived by linearly interpolating in the magnitude-log(mass) plane3 between the magnitudes of its closest mass neighbors. This was done on a star-by-star basis for all the stars sampled from all the star particles of a simulated galaxy. The resulting CMD of a simulated galaxy was then convolved with the observational errors to make the analysis observationally compliant.
We simulated observational errors on the resulting CMD using a procedure similar to that discussed in Gallart et al. (1996) and Hidalgo et al. (2011), where it is used to introduce observational errors in the synthetic CMD. This method is based on the artificial star tests, wherein artificial stars with known magnitudes are injected into the observed frames and the comparison of the injected and recovered stars provides information on crowding and incompleteness. For our purposes, we are only concerned with the incompleteness. Any star that was not recovered was discarded from the CMD.
Furthermore, for the stars that were recovered, the observational errors were calculated as the difference between the recovered and injected magnitudes of the artificial star. The information about incompleteness and observational errors obtained from the artificial star tests are given in crowding tables. In particular, we used the crowding table used in Meschin et al. (2014) to simultaneously simulate the incompleteness as well as the observational errors in the mock CMDs. In this way, observational errors were introduced in both the mock CMDs of the simulated galaxies and the model CMD.
The mock CMDs of the simulated galaxy DG-5 are shown in Fig. 2. The top panel shows the CMD that results directly from the interpolated magnitudes; the CMD in the bottom panel has been, in addition, convolved with the realistic observational errors and is, therefore, a more realistic representation of an observed CMD. From panel b of Fig. 2, it can be noted that the isochrone tracks are still visible for the brightest stars, where the photometric uncertainties are minimal. This is inherent to the process of obtaining photometric magnitudes of individual stars sampled from the same star-particle. Each star-particle constitutes a single stellar population with a given age and metallicity, and the photometric magnitudes of all the stars sampled from it are, therefore, obtained from the same isochrone. Since the synthetic CMD method relies on counting the number of stars in color-magnitude bins, which in practice smoothes out the distribution of stars in the CMD (see Aparicio & Hidalgo 2009), this feature does not influence our results. Having discussed the construction of realistic CMDs from simulation star-particle data, in the next section we discuss the method to retrieve the SFHs from the mock CMDs.
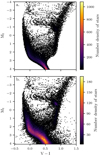 |
Fig. 2. Hess representation of un-convolved and convolved versions of CMD of the simulated dwarf galaxy DG-5. The magnitudes in panel a are a direct result from interpolating on the best matching isochrones (based on the age, metallicity, and mass of the sampled stars). The magnitudes in panel b are obtained by simulating observational errors using the crowding tables used in Meschin et al. (2014) to mimic the quality of real observational data. The color bars indicate the number density of stars in the corresponding plots, and the sparse black points represent individual stars in the CMD. |
4. Star-formation history from the mock CMDs
The star-formation history (SFH) is crucial to understanding the evolution of a galaxy, as it gives important clues about the internal and external drivers of its evolution. The SFH of a complex stellar population, such as a galaxy, can be inferred from its CMD by comparing the observed CMD with a theoretical or model CMD, encompassing various possible scenarios of its evolution. This is known as the synthetic CMD method. To put it simply, the synthetic CMD method is based on fitting the number of stars in various regions of the observed CMD with SSPs underlying the respective regions in a model CMD. We used the CMD-fitting technique, in particular the method described in Aparicio & Hidalgo (2009) as implemented in Bernard et al. (2015), to retrieve the SFH of the simulated dwarf galaxies from their mock CMDs. In the following section, we briefly review the parameters involved in the making of a model CMD, highlight the key features of the synthetic CMD method, and finally discuss the implementation of the synthetic CMD method used in this work.
4.1. The model CMD
To create the synthetic CMD, we used the publicly available IAC-star4 code (Aparicio & Gallart 2004). This code relies on a number of input parameters, which, along with their values used in this work, are summarized in Table 2. It must be noted that all the parameters described in Table 2 are kept as close as possible to those used in the construction of mock CMDs from the simulation star-particle data to avoid any systematic differences in the subsequent results. We constructed a single synthetic CMD with 50 million stars, which is used for analyzing all the simulations (the reasons behind this choice are discussed in Sect. 4.2). Finally, incompleteness and other observational errors were simulated in this synthetic CMD in the same way as was described in Sect. 3 for the case of mock CMDs. The resultant CMD was then directly comparable to the mock CMDs and is referred to as the model CMD.
Parameters used for creating a synthetic CMD.
4.2. The synthetic CMD method
In the mock CMDs, the total number of sampled stars varies from simulation to simulation and ranges from a few hundred thousand stars to a few million stars. Ideally, depending on the number of stars in the mock CMDs, each mock CMD would require a different model CMD with a sufficient number of stars. For example, a mock CMD with a million stars would ideally require a model CMD with ∼0.2 billion stars for a reasonable comparison.
However, making, as well as handling, such model CMDs with millions of stars is computationally very expensive. Therefore, we instead limited the number of stars in the densely populated mock CMDs to the population of 200 000 randomly selected stars and used a single model CMD for analyzing all our simulations. This 200 000 star threshold is motivated by observational studies such as those in the LCID project5, Bernard et al. (2018), etc., where the authors report similar numbers of observationally resolved stars for nearby dwarf galaxies. Furthermore, this not only saves the computational expense, but also ensures that the model CMD always has a lower Poisson noise than the mock CMD.
With the mock CMDs of simulated dwarf galaxies and a comparable model CMD in hand, we used the aforementioned implementation of the synthetic CMD method to solve for the SFHs of the simulated dwarf galaxies from their mock CMDs. This implementation of the CMD-fitting method has the provision to find the color-magnitude offset between the observed and the model CMDs, among other tunable input parameters. Since both the mock and the model CMDs are based on the same stellar evolutionary library, we set this offset to zero. Another interesting parameter is the selection of color-magnitude regions (referred to as “bundles” in Aparicio & Hidalgo 2009) based on which solution SFH is computed. Ruiz-Lara et al. (2018) show that including as many evolutionary phases as possible in the bundles leads to a more reliable recovered SFH, even though some of the evolutionary phases (such as the red-giant branch phase) might be affected by larger uncertainties. Consequently, in our analysis, we used a single bundle covering the entire model CMD. The bundle was further sub-divided into “bins”, and the solution SFH was computed based on the comparison between the mock and the model CMDs of the stars in these bins. We set the bin size in the defined bundle to 0.025 × 0.2 col−mag.
With the input parameters set to suitable values, a minimization algorithm tries to fit the number of stars in each of the bins in the mock CMD with the SSPs underlying the respective bins on the model CMD. We used a set of ∼350 SSPs6 for our analysis. The goodness of the fit was measured by the Poisson equivalent of χ2:  , adopted from Dolphin (2002). The coefficients of the best-fitting solution CMD are directly proportional to the birth-mass of the corresponding SSPs.
5. Results and discussion
5.1. V–I versus I CMDs
The SFR and the age-metallicity relation (AMR) are the two main results from the synthetic CMD analysis of the mock CMDs. Quantities from the solved SFHs are compared directly to their true values from the simulation star-particle data. Such a comparison for the selected representative cases, DG-5 and DG-22, is shown in Fig. 3, where the top panel shows the comparison of the SFR, the middle panel shows the comparison of the cumulative SFR (or cumulative fraction), and the bottom panel shows the comparison of the AMR. Red and black colors correspond to the true and the solved quantities, respectively. These are discussed in more detail in the following section. In addition, Fig. 4 shows the mock CMD (panel a), the solution CMD (panel b), and their likeness (panels c and d) for DG-5 and DG-22. The results from the analysis of the mock CMDs of other MoRIA dwarfs in our sample are presented in Appendix A.
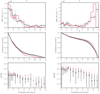 |
Fig. 3. Results from the V − I versus I CMD analyses of DG-5 (left) and DG-22 (right): solved SFH from the synthetic CMD method using 357 SSPs (in black) compared with the simulation star-particle data (in red) for the simulated dwarf galaxies DG-5 and DG-22 (see Table 1 for more details). Panels a: SFR as a function of the lookback time; panels b: cumulative mass fraction; and panels c: AMR. The gray points in the AMR depict the age bins where less than 1% of the total star formation took place, the black and gray lines show the error on the solved metallicity, and the scattered red points in the AMR show the true metallicities of each of the star particles in various age bins. |
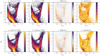 |
Fig. 4. Comparison of mock CMDs with solution CMDs of DG-5 (top) and DG-22 (bottom): as indicated, the first column represents the mock or observed CMDs, the second column represents the solution CMDs, the third column represents the residuals, and the fourth column represents the significance for the simulated dwarf galaxies DG-5 (upper panel) and DG-22 (lower panel). |
The solved SFR is directly compared to the true SFR from the simulation star-particle data. Panels a in Fig. 3 show the comparison of the true and the recovered SFRs of the simulated dwarf galaxies DG-5 and DG-22. We find a good agreement between the true and the recovered SFRs in all of the simulated dwarf galaxies in our sample. Notably, the star-formation peaks are well-recovered with a fair constraint on the time and duration of the star-formation phases.
The cumulative SFH, or cumulative mass fraction, is defined as the fraction of a galaxy’s total stellar mass that has been formed up to a certain time in its history since the birth of its first star. By definition, the cumulative fraction is zero before the first star is born and should be one at the current time. Due to the accumulative nature of the cumulative fraction, the errors on the solved SFR cannot be directly translated into the errors on the cumulative fraction. We therefore used bootstrapping to assign reasonable errors to the recovered cumulative fraction: From the solved SFR and its associated error in each age bin, we sampled 10 000 normally distributed alternative SFRs. Then we took the mean of the 10 000 different cumulative fractions resulting from the 10 000 different SFRs. Finally, we calculated the error on the cumulative fraction as the root-mean-square deviation on the mean cumulative SFH. Panels b in Fig. 3 show the comparison of the true and the solved cumulative fractions of the simulated dwarf galaxies DG-5 and DG-22 as a function of the lookback time.
Due to the prevalence of various definitions of metallicity in the literature, it is important that we specify the definition used in our work. The following definition of metallicity was used in all our calculations:
![$$ \begin{aligned} \Bigg [ \frac{M}{H}\Bigg ] = \log _{10}\Bigg ( \frac{Z}{Z_{\odot }}\Bigg ) , \end{aligned} $$](/articles/aa/full_html/2020/10/aa37142-19/aa37142-19-eq6.gif)
where Z is the mass fraction comprised of the total metal content of a star, and Z⊙ = 0.0198 (Grevesse & Noels 1993), is its solar value.
In each age bin, the true metallicity from the star-particle data was calculated as the median of the metallicities of the star particles born in that age bin. Panels c in Fig. 3 show the comparison of the true and the recovered AMRs of the simulated dwarf galaxies DG-5 and DG-22. The gray markers denote the age bins where the solved SFH indicates that less than 1% of the total star formation took place and are thus deemed unfit for comparison; the red dots show the scatter of metallicity of the individual star particles in each of the age bins. We find a good agreement between the true and the recovered AMRs as well.
5.1.1. Radial dependence of the retrieved SFH
In addition to the hitherto studied inner 1 kpc region of the simulated galaxies, we also studied the effect of using a smaller (0.5 kpc) and a larger (1.5 kpc) aperture on the resulting SFH. Results from this analysis for DG-5 and DG-22 are shown in Fig. 5. We find that the cumulative mass fraction approaches its maximum value more steeply at small lookback times as we go to smaller apertures. In other words, the fraction of young stars, and hence the rate of recent star formation, increases as one goes to smaller apertures. This age gradient is in line with stellar population studies of the Local Group dwarf galaxies (de Boer et al. 2012; Battaglia et al. 2012), where a similar radial age gradient is observed.
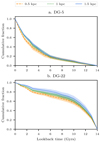 |
Fig. 5. Effect of using different apertures on the retrieved cumulative mass fraction of DG-5 (top) and DG-22 (bottom): the above plots show the comparison of the cumulative SFRs from considering three different apertures, where blue (solid), green (dotted), and orange (dashed) lines represent the solved SFR from considering 1.5 kpc, 1.0 kpc, and 0.5 kpc radial apertures from the center of the galaxy, respectively. |
5.1.2. Effects of dust extinction
We also explored the effects of dust extinction on the resulting CMD and hence on the SFHs derived from it. Since dust is not explicitly included in the simulations, we incorporated dust extinction in the post-processing following the procedure used by Hopkins et al. (2005), which relates dust extinction in the B-band to the gas metallicity and the HI column density:
where AB is the B-band extinction, NH is the hydrogen column density, Z is the gas metallicity, and (AB/NH)MW = 8.47 × 10⁻²² cm2. We calculated the hydrogen column density at the position of each of the star particles, and, using the above equation, we get the extinction AB in the B-band. Following Pei (1992), the extinction in the V- and I-bands can be written in terms of AB as
To study the effects of dust extinction on the resultant SFH, the extinction values thus calculated were included in the V-I vs I mock CMDs. The result can be seen in Fig. 6, where we show the effect of the adopted dust prescription on the mock CMDs of DG-5 and DG-22.
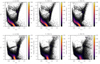 |
Fig. 6. Effects of the adopted extinction prescription on the observed CMDs of DG-5 (top) and DG-22 (bottom). Left column: dust-free CMDs; middle panel: CMDs computed using the extinction prescription (5); and right column: CMDs computed for three times the nominal amount of extinction. As explained in Sect. 3.2, sharp features are visible in the CMDs due to each star particle constituting a single stellar population, but this does not affect the analysis. |
The SFHs obtained from such dust-affected CMDs of DG-5 and DG-22 are shown in Fig. 7. These SFHs are compared to the case without dust extinction and the true SFH from the simulation star-particle data. The most striking effect of dust on the retrieved SFH is the significant underestimation of the SFR within the last 0.5 Gyr and the related overestimation of the SFR at larger lookback times, up to 1 Gyr. This can be explained as follows. Since young stellar particles preferentially reside in environments with high gas densities and metallicities, they will be the most strongly affected by dust extinction. This, to some extent, depopulates the blue side of the main sequence while pushing stars toward fainter magnitudes and redder colors, leading to an underestimation of the most recent star formation and an overestimation of past star formation in the retrieved SFH. In DG-5, with a maximum extinction of 0.1 mag in the I-band, the SFR in the youngest age bin is underestimated by 15%. Likewise, in DG-22, with a maximum extinction of 0.8 mags in the I-band, the SFR in the youngest age bin is underestimated by 25% compared with the case without any dust extinction.
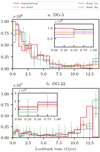 |
Fig. 7. Effect of dust absorption on the retrieved SFR of DG-5 (top) and DG-22 (bottom). In both panels, the orange line represents SFR without taking dust extinction into account; the purple and green lines represent cases with varying amounts of dust extinction as indicated in the legend; and the red line represents the true SFR from the simulation snapshot data. The smaller panes show a zoomed-in view of the SFR in the most recent age bins, where the effects of dust extinction are most striking. |
Given the finite resolution inherent to the SPH formalism, very high-density and strongly obscured regions are absent from simulations such as these, and we may be underestimating the “true” extinction. To assess how strongly the presence of the amount of dust affects the retrieved SFH, we scaled up the nominal extinction by a factor of three for both galaxies. These CMDs are presented in the rightmost columns of Fig. 6. The retrieved SFHs are shown in Fig. 7. The trend suggested by the fiducial dust extinction experiment is confirmed here: The SFR in the most recent age bin is even more strongly underestimated (by ∼40% in the case of DG-5) while the SFR in older age bins, up to 1 Gyr ago, is overestimated by ∼20%. At even larger lookback times, the shuffling of stars leads to random variations of the retrieved SFR that stay well within the error bars.
In another, more extreme, test designed to mimic the very strong extinction of stars in high-density gas clouds, we simply removed all stellar particles from the CMD in regions where the gas density exceeds 1 amu cm−3. The SFH solved from such an extremely dust-affected CMD predictably shows a significantly lower recent SFR compared with the dust-free case (it is down by ∼30%). Such lowered recent SFR is of course expected, as the new-born stars are obscured by the dense gas clouds in which they are formed. Since in this experiment we are simply removing stars and not reddening and dimming them, there is no accompanying overestimation of past star formation. In fact, the SFH is also lowered up to a few billion years of lookback time. This is most likely due to the “accidental” obscuration of older star particles that happen to reside inside a high-density gas cloud. This is not wholly unexpected since the star-formation regions are embedded in a background population of older stars.
5.2. I–H versus I CMDs
With the focus of future instruments shifting more towards infrared wavelengths, such as E-ELT/MICADO (Davies et al. 2016) and JWST/NIRCam (Beichman et al. 2012), we also investigated the infrared (I, H) CMDs of the simulated galaxies. Here, we show results from the analysis of infrared CMDs of simulated dwarfs with three representative SFH scenarios: (i) DG-5, with a recent star formation; (ii) DG-22 and DG-18, with an early star-formation episode; and (iii) DG-20, with a nearly constant SFR. Results for DG-5 and DG-22 are shown in Fig. 8, and those for DG-18 and DG-20 are shown in Fig. B.1. We see that the (I, H) CMDs give results very similar to those from the optical (V, I) CMDs and that the recovered SFRs and AMRs adhere closely to those derived from the star-particle data. Hence, SFH derived from resolved stellar populations studies with the upcoming infrared instruments are also directly comparable to those derived from galaxy simulations.
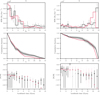 |
Fig. 8. Results from the I, H CMDs analysis of DG-5 (left) and DG-22 (right): the panels and symbols have the same description as in Fig. 3. |
Due to the unavailability of crowding tables in the infrared band, the observational errors in the I, H CMDs were simulated in a different manner, as described below. The observational errors reported in Monelli et al. (2010; for the I-band) and in Dong et al. (2017; for the H-band) were approximated with polynomial functions of absolute magnitudes. Using these relations, the corresponding values of errors were obtained depending on the photometric magnitude of a star. These values were then used as the standard deviations for Gaussian distributions with zero mean, and the resultant magnitudes of a star were obtained by convolving its magnitudes with random values sampled from these Gaussians.
6. Summary and conclusions
In this paper, we analyzed a set of 24 MoRIA dwarf galaxy simulations using an observational approach to investigate any systematic differences in the comparison of simulations with observations. To do so, we created realistic V − I versus I CMDs of simulated dwarf galaxies from their simulation star-particle data. From these “observed" or mock CMDs, we derived the SFHs of the simulated dwarf galaxies using the synthetic CMD method. The recovered or solved SFHs were then compared to their true values from the simulation star-particle data, mainly in terms of the SFR and the AMR.
We find that the recovered SFHs are in very good agreement with the true SFHs (Fig. 3 and figures in Appendix A). There are no systematic differences between the SFHs retrieved from the data and the star-particle data of the simulations, and we, therefore, conclude that quantities like the SFR and the AMR derived from the photometric observations of galaxies are directly comparable to their simulated counterparts.
Our experiments with dusty CMDs show that extinction and reddening can lead to a significant underestimation of the SFR during the most recent 0.5 Gyr, with the strength and the duration of this effect dependent on the amount of dust (quantified here by the maximum inflicted extinction). In turn, at larger lookback times, the SFR is overestimated.
As the focus of the next-generation instruments is shifting towards the infrared range of the spectrum, we also analyzed the CMDs with infrared bands (I- and H-bands). The synthetic CMD analysis of the infrared I − H versus H CMDs gives results quite similar to those from the optical V − I versus I CMDs, and in good agreement with the ground truth from the simulation star-particle data (Fig. 8). This paves the way for resolved stellar population studies with future infrared facilities, such as JWST and E-ELT.
Grid formed by the following age and metallicity bins. Age (Gyr): [0., 0.5, 1., 1.5, 2., 2.5, 3., 4., 5., 6., 7., 8., 9., 10., 11., 12., 13., 14.]. Metallicity (Z): [0.0001, 0.00015, 0.0002, 0.0003, 0.0004, 0.0007, 0.0011, 0.0016, 0.0022, 0.0029, 0.0037, 0.0046, 0.0056, 0.0067, 0.0079, 0.0092, 0.0106, 0.0122, 0.0140, 0.0160, 0.0182, 0.03].
Acknowledgments
We thank the anonymous referee for their valuable comments which have helped improve the content of the manuscript. We would also like to thank S. L. Hidalgo and I. Meschin for kindly providing the crowding tables for our analysis. SR, SDR and MM acknowledge financial support from the European Union’s Horizon 2020 research and innovation programme under Marie Skłodowska-Curie grant agreement No 721463 to the SUNDIAL ITN network. This work has made use of the IAC-STAR Synthetic CMD computation code. IAC-STAR is supported and maintained by the IAC’s IT Division. Software: numpy (Oliphant 2006), scipy (Virtanen et al. 2020), matplotlib (Hunter 2007), astropy (Astropy Collaboration 2018) and pynbody (Pontzen et al. 2013).
References
- Aparicio, A., & Gallart, C. 2004, AJ, 128, 1465 [NASA ADS] [CrossRef] [Google Scholar]
- Aparicio, A., & Hidalgo, S. L. 2009, AJ, 138, 558 [NASA ADS] [CrossRef] [MathSciNet] [Google Scholar]
- Aparicio, A., Hidalgo, S. L., Skillman, E., et al. 2016, ApJ, 823, 9 [CrossRef] [Google Scholar]
- Astropy Collaboration (Price-Whelan, A. M., et al.) 2018, AJ, 156, 123 [Google Scholar]
- Battaglia, G., Irwin, M., Tolstoy, E., de Boer, T., & Mateo, M. 2012, ApJ, 761, L31 [NASA ADS] [CrossRef] [Google Scholar]
- Beichman, C. A., Rieke, M., Eisenstein, D., et al. 2012, in Science Opportunities with the Near-IR Camera (NIRCam) on the James Webb Space Telescope (JWST), SPIE Conf. Ser., 8442, 84422N [NASA ADS] [Google Scholar]
- Bernard, E. J., Ferguson, A. M., Barker, M. K., et al. 2012, MNRAS, 420, 2625 [NASA ADS] [CrossRef] [Google Scholar]
- Bernard, E. J., Ferguson, A. M. N., Richardson, J. C., et al. 2015, MNRAS, 446, 2789 [NASA ADS] [CrossRef] [Google Scholar]
- Bernard, E. J., Schultheis, M., Di Matteo, P., et al. 2018, MNRAS, 477, 3507 [NASA ADS] [CrossRef] [Google Scholar]
- Bernstein, R. A., McCarthy, P. J., Raybould, K., et al. 2014, in Ground-based and Airborne Telescopes V, Proc. SPIE, 9145, 91451 [NASA ADS] [Google Scholar]
- Boylan-Kolchin, M., Bullock, J. S., & Kaplinghat, M. 2011, MNRAS, 415, L40 [CrossRef] [Google Scholar]
- Bullock, J. S., & Boylan-Kolchin, M. 2017, ARA&A, 55, 343 [NASA ADS] [CrossRef] [Google Scholar]
- Cassisi, S., Castellani, V., Ciarcelluti, P., Piotto, G., & Zoccali, M. 2000, MNRAS, 315, 679 [NASA ADS] [CrossRef] [Google Scholar]
- Castelli, F., & Kurucz, R. L. 2003, in Modelling of Stellar Atmospheres, eds. N. Piskunov, W. W. Weiss, & D. F. Gray, IAU Symp., 210, A20 [Google Scholar]
- Chabrier, G. 2003, PASP, 115, 763 [Google Scholar]
- Cloet-Osselaer, A., De Rijcke, S., Schroyen, J., & Dury, V. 2012, MNRAS, 423, 735 [NASA ADS] [CrossRef] [Google Scholar]
- Cloet-Osselaer, A., De Rijcke, S., Vandenbroucke, B., et al. 2014, MNRAS, 442, 2909 [NASA ADS] [CrossRef] [Google Scholar]
- Da Silva, R. L., Fumagalli, M., & Krumholz, M. 2012, ApJ, 745, 145 [NASA ADS] [CrossRef] [Google Scholar]
- Davies, R., Schubert, J., Hartl, M., et al. 2016, in MICADO: first light imager for the E-ELT, SPIE Conf. Ser., 9908, 99081Z [NASA ADS] [Google Scholar]
- de Boer, T. J. L., Tolstoy, E., Hill, V., et al. 2012, A&A, 544, A73 [NASA ADS] [CrossRef] [EDP Sciences] [Google Scholar]
- De Rijcke, S., Schroyen, J., Vandenbroucke, B., et al. 2013, MNRAS, 433, 3005 [NASA ADS] [CrossRef] [Google Scholar]
- Dolphin, A. 1997, New Astron., 2, 397 [NASA ADS] [CrossRef] [Google Scholar]
- Dolphin, A. E. 2002, MNRAS, 332, 91 [NASA ADS] [CrossRef] [Google Scholar]
- Dong, H., Schödel, R., Williams, B. F., et al. 2017, MNRAS, 470, 3427 [NASA ADS] [CrossRef] [Google Scholar]
- Fattahi, A., Navarro, J. F., Frenk, C. S., et al. 2018, MNRAS, 476, 3816 [Google Scholar]
- Ferguson, H. C., & Binggeli, B. 1994, A&A Rev., 6, 67 [NASA ADS] [CrossRef] [Google Scholar]
- Gallart, C., Aparicio, A., & Vilchez, J. M. 1996, AJ, 112, 1928 [NASA ADS] [CrossRef] [EDP Sciences] [Google Scholar]
- Gardner, J. P., Mather, J. C., Clampin, M., et al. 2006, Space Sci. Rev., 123, 485 [NASA ADS] [CrossRef] [Google Scholar]
- Gilmozzi, R., & Spyromilio, J. 2007, The Messenger, 127, 3 [NASA ADS] [Google Scholar]
- Grevesse, N., & Noels, A. 1993, in Origin and Evolution of the Elements, eds. N. Prantzos, E. Vangioni-Flam, & M. Casse, 15 [Google Scholar]
- Haas, M. R., & Anders, P. 2010, A&A, 512, A79 [NASA ADS] [CrossRef] [EDP Sciences] [Google Scholar]
- Hidalgo, S. L., Aparicio, A., Skillman, E., et al. 2011, ApJ, 730, 14 [NASA ADS] [CrossRef] [Google Scholar]
- Hopkins, P. F., Hernquist, L., Martini, P., et al. 2005, ApJ, 625, L71 [Google Scholar]
- Hunter, J. D. 2007, Comput. Sci. Eng., 9, 90 [NASA ADS] [CrossRef] [Google Scholar]
- Kauffmann, G., White, S. D. M., & Guiderdoni, B. 1993, MNRAS, 264, 201 [Google Scholar]
- Klypin, A., Kravtsov, A. V., Valenzuela, O., & Prada, F. 1999, ApJ, 522, 82 [Google Scholar]
- McQuinn, K. B. W., Skillman, E. D., Dolphin, A., et al. 2015, ApJ, 812, 158 [NASA ADS] [CrossRef] [Google Scholar]
- Meschin, I., Gallart, C., Aparicio, A., et al. 2014, MNRAS, 438, 1067 [Google Scholar]
- Monelli, M., Hidalgo, S. L., Stetson, P. B., et al. 2010, ApJ, 720, 1225 [NASA ADS] [CrossRef] [Google Scholar]
- Moore, B., Ghigna, S., Governato, F., et al. 1999, ApJ, 524, L19 [Google Scholar]
- Oliphant, T. E. 2006, A Guide to NumPy (Trelgol Publishing USA), 1 [Google Scholar]
- Papastergis, E., & Shankar, F. 2016, A&A, 591, A58 [NASA ADS] [CrossRef] [EDP Sciences] [Google Scholar]
- Pei, Y. C. 1992, ApJ, 395, 130 [NASA ADS] [CrossRef] [Google Scholar]
- Pietrinferni, A., Cassisi, S., Salaris, M., & Castelli, F. 2004, ApJ, 612, 168 [NASA ADS] [CrossRef] [Google Scholar]
- Pietrinferni, A., Cassisi, S., Salaris, M., & Castelli, F. 2006, ApJ, 642, 797 [NASA ADS] [CrossRef] [Google Scholar]
- Pietrinferni, A., Cassisi, S., Salaris, M., & Hidalgo, S. 2013, A&A, 558, A46 [NASA ADS] [CrossRef] [EDP Sciences] [Google Scholar]
- Pineda, J. C. B., Hayward, C. C., Springel, V., & Mendes de Oliveira, C. 2017, MNRAS, 466, 63 [NASA ADS] [CrossRef] [Google Scholar]
- Planck Collaboration XIII. 2016, A&A, 594, A13 [NASA ADS] [CrossRef] [EDP Sciences] [Google Scholar]
- Pontzen, A., Roškar, R., Stinson, G., & Woods, R. 2013, Astrophysics Source Code Library [record ascl:1305.002] [Google Scholar]
- Read, J. I., Agertz, O., & Collins, M. L. M. 2016, MNRAS, 459, 2573 [NASA ADS] [CrossRef] [Google Scholar]
- Revaz, Y., & Jablonka, P. 2012, A&A, 538, A82 [NASA ADS] [CrossRef] [EDP Sciences] [Google Scholar]
- Rubele, S., Girardi, L., Kozhurina-Platais, V., Goudfrooij, P., & Kerber, L. 2011, MNRAS, 414, 2204 [NASA ADS] [CrossRef] [Google Scholar]
- Ruiz-Lara, T., Gallart, C., Beasley, M., et al. 2018, A&A, 617, 1 [CrossRef] [EDP Sciences] [Google Scholar]
- Sales, L. V., Navarro, J. F., Oman, K., et al. 2017, MNRAS, 464, 2419 [CrossRef] [Google Scholar]
- Sawala, T., Frenk, C. S., Fattahi, A., et al. 2016, MNRAS, 457, 1931 [NASA ADS] [CrossRef] [Google Scholar]
- Schaller, M., Frenk, C. S., Bower, R. G., et al. 2015, MNRAS, 451, 1247 [NASA ADS] [CrossRef] [Google Scholar]
- Schroyen, J., de Rijcke, S., Valcke, S., Cloet-Osselaer, A., & Dejonghe, H. 2011, MNRAS, 416, 601 [NASA ADS] [Google Scholar]
- Shen, S., Madau, P., Conroy, C., Governato, F., & Mayer, L. 2014, ApJ, 792, 99 [NASA ADS] [CrossRef] [Google Scholar]
- Skidmore, W., 2015, Res. Astron. Astrophys., 15, 1945 [CrossRef] [Google Scholar]
- Skillman, E. D., Monelli, M., Weisz, D. R., et al. 2017, ApJ, 837, 102 [NASA ADS] [CrossRef] [Google Scholar]
- Snyder, G. F., Torrey, P., Lotz, J. M., et al. 2015, MNRAS, 454, 1886 [NASA ADS] [CrossRef] [Google Scholar]
- Springel, V. 2005, MNRAS, 364, 1105 [NASA ADS] [CrossRef] [Google Scholar]
- Tolstoy, E., & Saha, A. 1996, ApJ, 462, 672 [Google Scholar]
- Tosi, M., Greggio, L., Marconi, G., & Focardi, P. 1991, AJ, 102, 951 [NASA ADS] [CrossRef] [Google Scholar]
- van den Bosch, F. C., & Swaters, R. A. 2001, MNRAS, 325, 1017 [NASA ADS] [CrossRef] [Google Scholar]
- Vandenbroucke, B., Verbeke, R., & De Rijcke, S. 2016, MNRAS, 458, 912 [NASA ADS] [CrossRef] [Google Scholar]
- Verbeke, R., Vandenbroucke, B., & De Rijcke, S. 2015, ApJ, 815, 85 [NASA ADS] [CrossRef] [Google Scholar]
- Verbeke, R., Papastergis, E., Ponomareva, A. A., Rathi, S., & De Rijcke, S. 2017, A&A, 607, A13 [NASA ADS] [CrossRef] [EDP Sciences] [Google Scholar]
- Virtanen, P., Gommers, R., Oliphant, T. E., et al. 2020, Nat. Methods, 17, 261 [Google Scholar]
- Wang, L., Dutton, A. A., Stinson, G. S., et al. 2015, MNRAS, 454, 83 [NASA ADS] [CrossRef] [Google Scholar]
- Weisz, D. R., Dolphin, A. E., Skillman, E. D., et al. 2014, ApJ, 789, 148 [NASA ADS] [CrossRef] [Google Scholar]
Appendix A: Complete results from the V−I versus I CMDs
Figure A.1 show the comparison of the solved SFHs with their true values for the complete set of simulations studied in this work. They are arranged in increasing order of their total stellar mass.
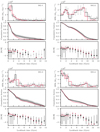 |
Fig. A.1. Comparison of true SFH (in red) with that from the CMD fitting of mock CMDs (in black). The panels and symbols have the same description as in Fig. 3. |
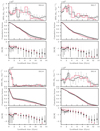 |
Fig. A.1. continued. |
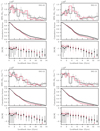 |
Fig. A.1. continued. |
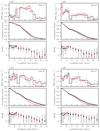 |
Fig. A.1. continued. |
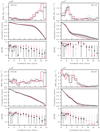 |
Fig. A.1. continued. |
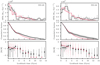 |
Fig. A.1. continued. |
Appendix B: Results from the I, H CMDs (DG-18 and DG-20)
In view of the resolved stellar population studies with the next-generation infrared instruments on JWST (Beichman et al. 2012) and E-ELT, we performed the synthetic CMD analysis with the infrared CMDs, in particular using the I- and H-bands. These bands are quite similar to the proposed F090W- and F150W-bands for studying the resolved stellar populations in some of the early release science of the JWST. Results from the I, H CMDs analysis of DG-18 (with an early star formation) and DG-20 (with nearly constant star formation) are shown in Fig. B.1.
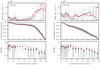 |
Fig. B.1. Results from I, H CMDs analysis of DG-18 and DG-20: comparison of true SFH (in red) with that from the CMD fitting of mock CMDs (in black). Panels and symbols have the same description as in Fig. 3. |
All Tables
All Figures
|
Fig. 1. Mass distribution of the sampled stars of the simulated dwarf galaxy DG-5 based on the method described in Sect. 3.1. Panel a: Chabrier IMF described by Eq. (1) and panel b: cumulative IMF given by Eq. (2). The sampled distributions are represented by blue circles and the analytical functions are shown by the dashed red lines. |
| In the text | |
|
Fig. 2. Hess representation of un-convolved and convolved versions of CMD of the simulated dwarf galaxy DG-5. The magnitudes in panel a are a direct result from interpolating on the best matching isochrones (based on the age, metallicity, and mass of the sampled stars). The magnitudes in panel b are obtained by simulating observational errors using the crowding tables used in Meschin et al. (2014) to mimic the quality of real observational data. The color bars indicate the number density of stars in the corresponding plots, and the sparse black points represent individual stars in the CMD. |
| In the text | |
|
Fig. 3. Results from the V − I versus I CMD analyses of DG-5 (left) and DG-22 (right): solved SFH from the synthetic CMD method using 357 SSPs (in black) compared with the simulation star-particle data (in red) for the simulated dwarf galaxies DG-5 and DG-22 (see Table 1 for more details). Panels a: SFR as a function of the lookback time; panels b: cumulative mass fraction; and panels c: AMR. The gray points in the AMR depict the age bins where less than 1% of the total star formation took place, the black and gray lines show the error on the solved metallicity, and the scattered red points in the AMR show the true metallicities of each of the star particles in various age bins. |
| In the text | |
|
Fig. 4. Comparison of mock CMDs with solution CMDs of DG-5 (top) and DG-22 (bottom): as indicated, the first column represents the mock or observed CMDs, the second column represents the solution CMDs, the third column represents the residuals, and the fourth column represents the significance for the simulated dwarf galaxies DG-5 (upper panel) and DG-22 (lower panel). |
| In the text | |
|
Fig. 5. Effect of using different apertures on the retrieved cumulative mass fraction of DG-5 (top) and DG-22 (bottom): the above plots show the comparison of the cumulative SFRs from considering three different apertures, where blue (solid), green (dotted), and orange (dashed) lines represent the solved SFR from considering 1.5 kpc, 1.0 kpc, and 0.5 kpc radial apertures from the center of the galaxy, respectively. |
| In the text | |
|
Fig. 6. Effects of the adopted extinction prescription on the observed CMDs of DG-5 (top) and DG-22 (bottom). Left column: dust-free CMDs; middle panel: CMDs computed using the extinction prescription (5); and right column: CMDs computed for three times the nominal amount of extinction. As explained in Sect. 3.2, sharp features are visible in the CMDs due to each star particle constituting a single stellar population, but this does not affect the analysis. |
| In the text | |
|
Fig. 7. Effect of dust absorption on the retrieved SFR of DG-5 (top) and DG-22 (bottom). In both panels, the orange line represents SFR without taking dust extinction into account; the purple and green lines represent cases with varying amounts of dust extinction as indicated in the legend; and the red line represents the true SFR from the simulation snapshot data. The smaller panes show a zoomed-in view of the SFR in the most recent age bins, where the effects of dust extinction are most striking. |
| In the text | |
|
Fig. 8. Results from the I, H CMDs analysis of DG-5 (left) and DG-22 (right): the panels and symbols have the same description as in Fig. 3. |
| In the text | |
|
Fig. A.1. Comparison of true SFH (in red) with that from the CMD fitting of mock CMDs (in black). The panels and symbols have the same description as in Fig. 3. |
| In the text | |
|
Fig. A.1. continued. |
| In the text | |
|
Fig. A.1. continued. |
| In the text | |
|
Fig. A.1. continued. |
| In the text | |
|
Fig. A.1. continued. |
| In the text | |
|
Fig. A.1. continued. |
| In the text | |
|
Fig. B.1. Results from I, H CMDs analysis of DG-18 and DG-20: comparison of true SFH (in red) with that from the CMD fitting of mock CMDs (in black). Panels and symbols have the same description as in Fig. 3. |
| In the text | |
Current usage metrics show cumulative count of Article Views (full-text article views including HTML views, PDF and ePub downloads, according to the available data) and Abstracts Views on Vision4Press platform.
Data correspond to usage on the plateform after 2015. The current usage metrics is available 48-96 hours after online publication and is updated daily on week days.
Initial download of the metrics may take a while.