Fig. 2.
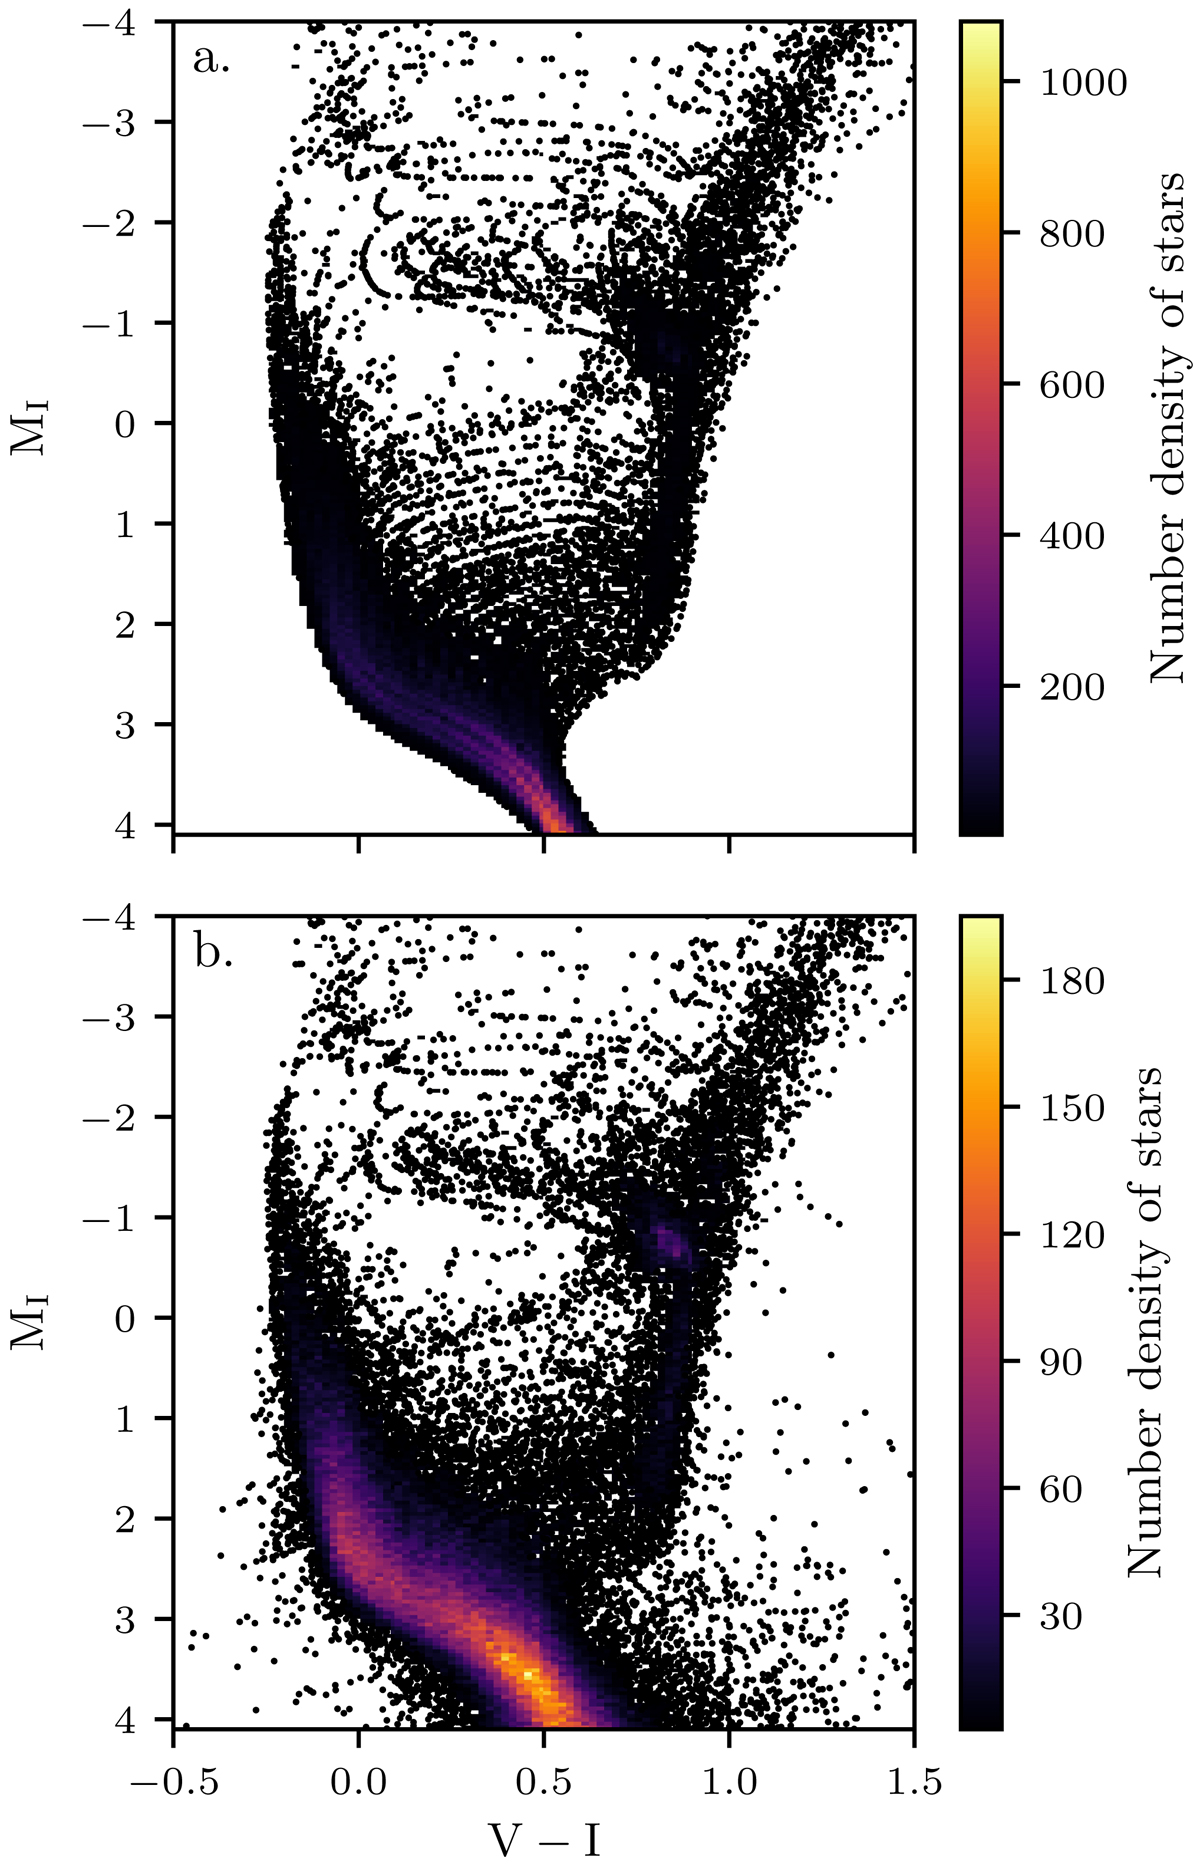
Hess representation of un-convolved and convolved versions of CMD of the simulated dwarf galaxy DG-5. The magnitudes in panel a are a direct result from interpolating on the best matching isochrones (based on the age, metallicity, and mass of the sampled stars). The magnitudes in panel b are obtained by simulating observational errors using the crowding tables used in Meschin et al. (2014) to mimic the quality of real observational data. The color bars indicate the number density of stars in the corresponding plots, and the sparse black points represent individual stars in the CMD.
Current usage metrics show cumulative count of Article Views (full-text article views including HTML views, PDF and ePub downloads, according to the available data) and Abstracts Views on Vision4Press platform.
Data correspond to usage on the plateform after 2015. The current usage metrics is available 48-96 hours after online publication and is updated daily on week days.
Initial download of the metrics may take a while.