Open Access
Fig. 9.
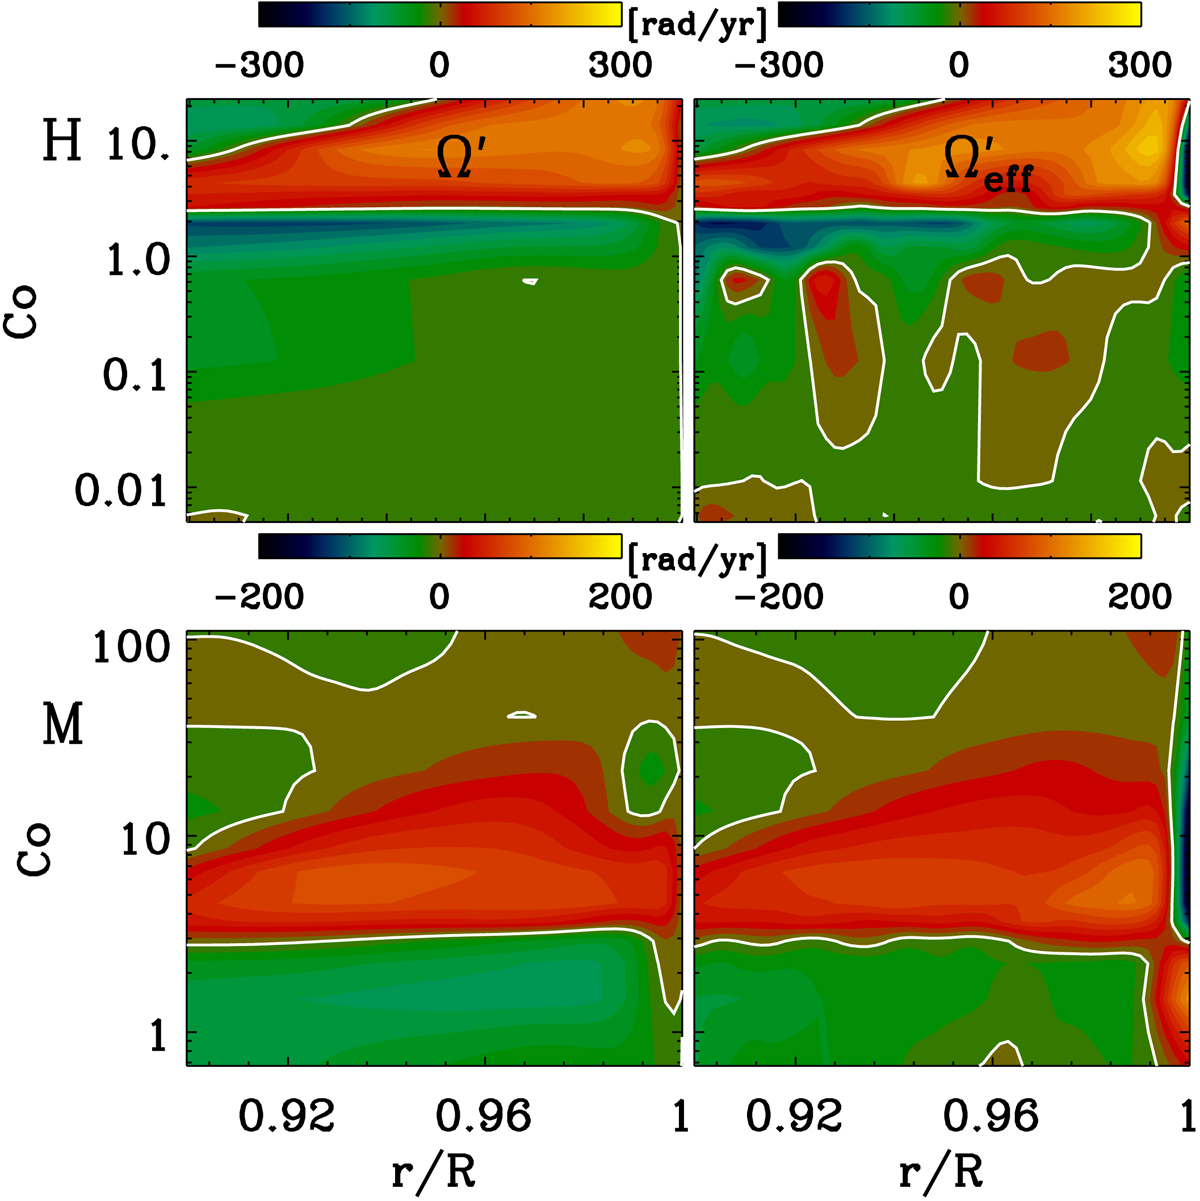
Variation of radial shear of the mean flow Ω′ and the effective flow ![]() with rotation. We plot Ω′ (first column) and
with rotation. We plot Ω′ (first column) and ![]() (second column) at 25° latitude as a function of Co for the HD runs (Set H) in the top row and for the MHD runs (Set M) in the bottom row. The zero values are indicated with a white line.
(second column) at 25° latitude as a function of Co for the HD runs (Set H) in the top row and for the MHD runs (Set M) in the bottom row. The zero values are indicated with a white line.
Current usage metrics show cumulative count of Article Views (full-text article views including HTML views, PDF and ePub downloads, according to the available data) and Abstracts Views on Vision4Press platform.
Data correspond to usage on the plateform after 2015. The current usage metrics is available 48-96 hours after online publication and is updated daily on week days.
Initial download of the metrics may take a while.