Fig. 3.
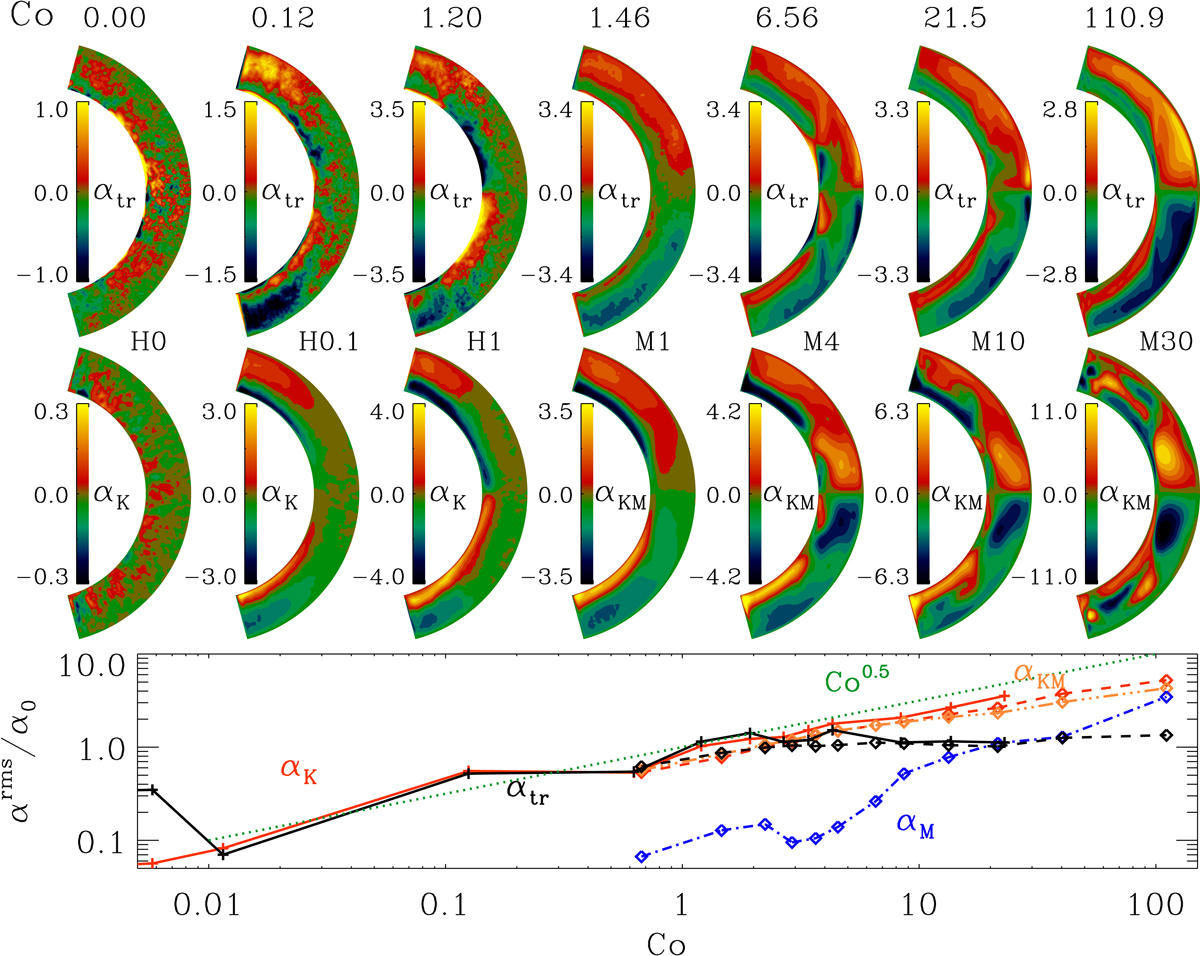
Rotational dependence of the α profiles calculated with test-field method and calculated from helicities. In the first row, we plot the traces of the α tensors, αtr, which were determined using the test-field method for a selection of HD (Set H) and MHD runs (Set M). In the second row, we plot the kinetic αK and the sum of kinetic and magnetic alpha αKM for the corresponding runs of Set H and Set M, respectively. In the last row, we show the root-mean-square values of the trace of the α tensor, αtr (black lines), the kinetic αK (red), the magnetic αM (blue), and their sum αKM (orange) for all runs. The values of the HD runs are shown with a solid line and crosses, whereas the MHD runs are shown with a dashed line with diamonds. The greed dotted line indicates a power law with an exponent of 0.5. All values are normalized by ![]() . The zero rotation run has been moved to Co = 10−4 to be visible in the lower panel.
. The zero rotation run has been moved to Co = 10−4 to be visible in the lower panel.
Current usage metrics show cumulative count of Article Views (full-text article views including HTML views, PDF and ePub downloads, according to the available data) and Abstracts Views on Vision4Press platform.
Data correspond to usage on the plateform after 2015. The current usage metrics is available 48-96 hours after online publication and is updated daily on week days.
Initial download of the metrics may take a while.