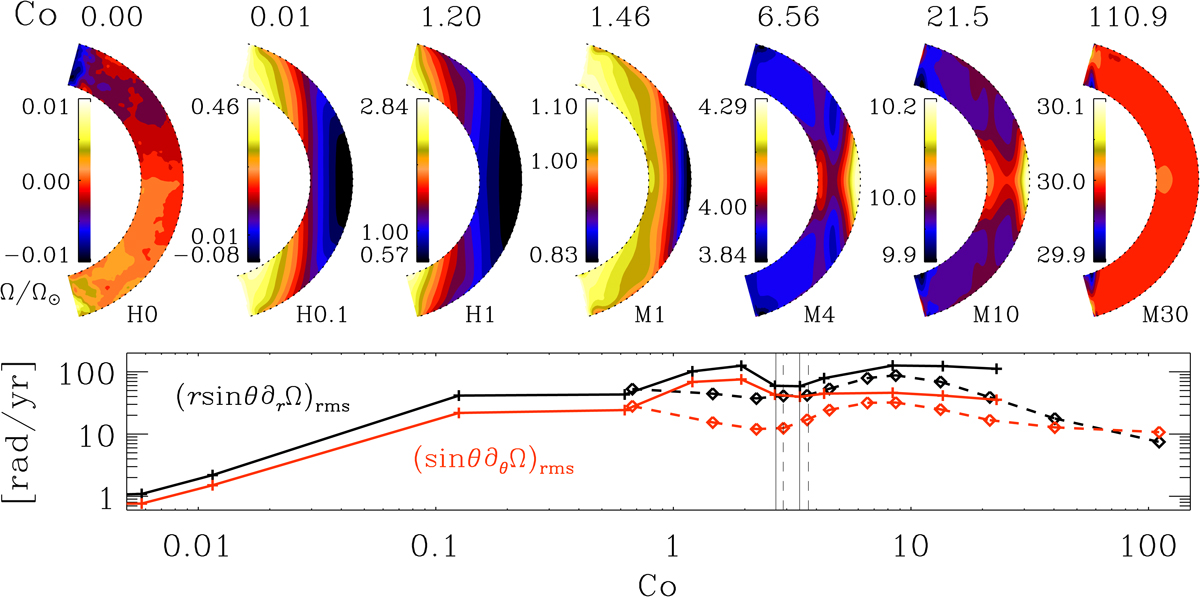
Fig. 2.

Normalized local rotation profiles Ω/Ω⊙ with ![]() for Runs H0, H0.1, H1, M1, M4, M10, M30 and the rms values of the radial r sin θ∂Ω/∂r (black line) and latitudinal shear sin θ∂Ω/∂θ (red) versus Coriolis number Co. The values have been calculated as a time average over the saturated state, and we have omitted the 5 closest grid points to the latitudinal boundary to remove boundary effects from the rms. The values of the HD runs (Set H) are shown with a solid line with plusses and the MHD runs (Set M) with dashed line with diamonds. The zero rotation run has been moved to Co = 10−4 to be visible in the lower panel. The transition from anti-solar to solar-like differential rotations occurs in between the vertical lines (left line: last anti-solar run, right line: first solar-like run) and is shown as solid (Set H) and dashed (Set M) lines.
for Runs H0, H0.1, H1, M1, M4, M10, M30 and the rms values of the radial r sin θ∂Ω/∂r (black line) and latitudinal shear sin θ∂Ω/∂θ (red) versus Coriolis number Co. The values have been calculated as a time average over the saturated state, and we have omitted the 5 closest grid points to the latitudinal boundary to remove boundary effects from the rms. The values of the HD runs (Set H) are shown with a solid line with plusses and the MHD runs (Set M) with dashed line with diamonds. The zero rotation run has been moved to Co = 10−4 to be visible in the lower panel. The transition from anti-solar to solar-like differential rotations occurs in between the vertical lines (left line: last anti-solar run, right line: first solar-like run) and is shown as solid (Set H) and dashed (Set M) lines.
Current usage metrics show cumulative count of Article Views (full-text article views including HTML views, PDF and ePub downloads, according to the available data) and Abstracts Views on Vision4Press platform.
Data correspond to usage on the plateform after 2015. The current usage metrics is available 48-96 hours after online publication and is updated daily on week days.
Initial download of the metrics may take a while.


