Open Access
Fig. A.5.
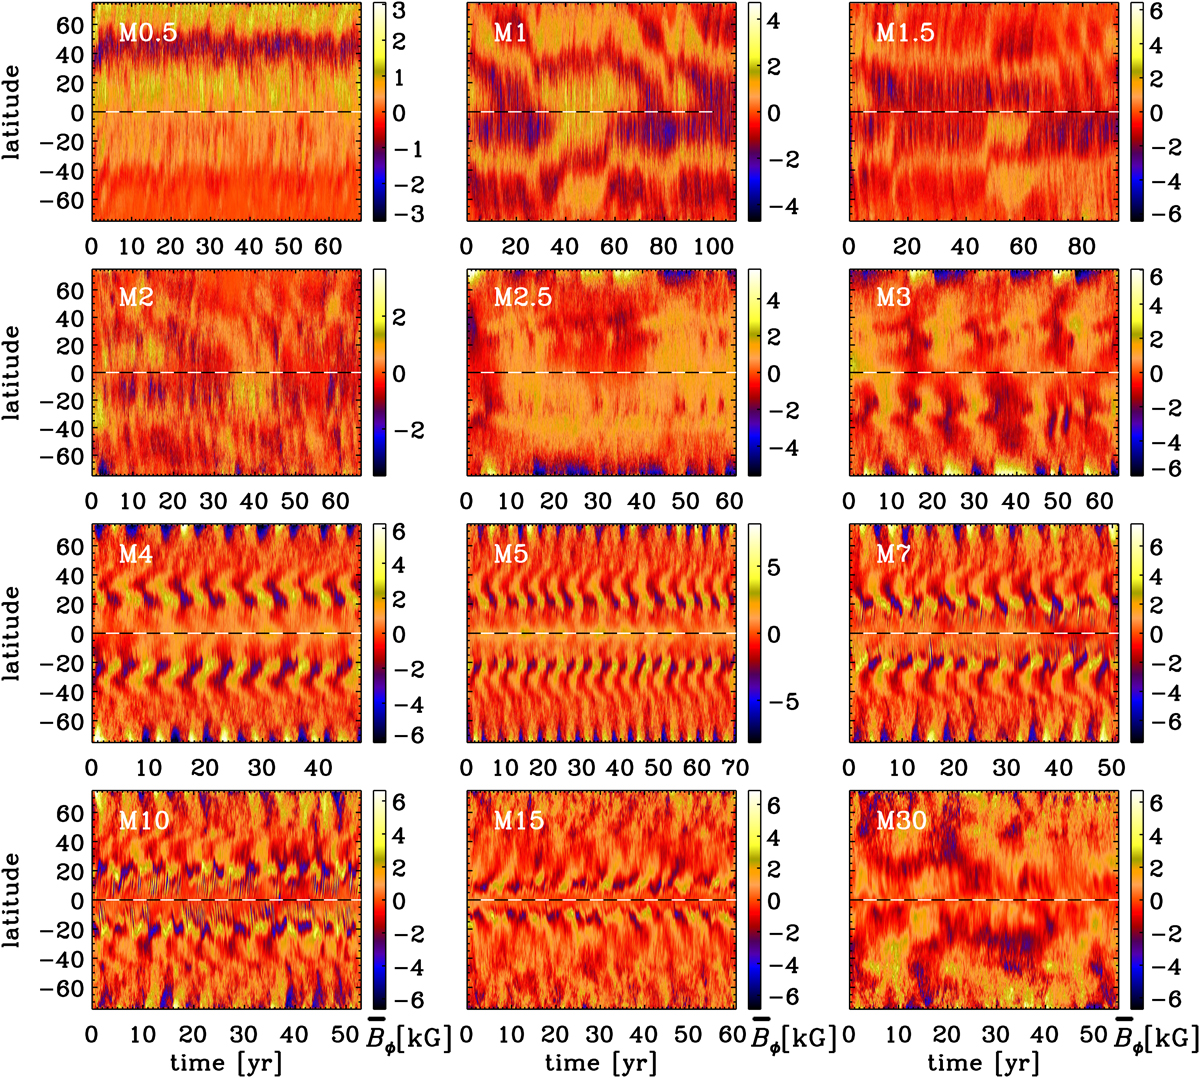
Mean azimuthal magnetic field ![]() as a function of time in years and latitude near the surface (r = 0.98R) for all MHD runs (Set M). The time interval shows the full duration of the saturated state for all runs. The black and white dashed horizontal line indicates the equator.
as a function of time in years and latitude near the surface (r = 0.98R) for all MHD runs (Set M). The time interval shows the full duration of the saturated state for all runs. The black and white dashed horizontal line indicates the equator.
Current usage metrics show cumulative count of Article Views (full-text article views including HTML views, PDF and ePub downloads, according to the available data) and Abstracts Views on Vision4Press platform.
Data correspond to usage on the plateform after 2015. The current usage metrics is available 48-96 hours after online publication and is updated daily on week days.
Initial download of the metrics may take a while.