Fig. 12.
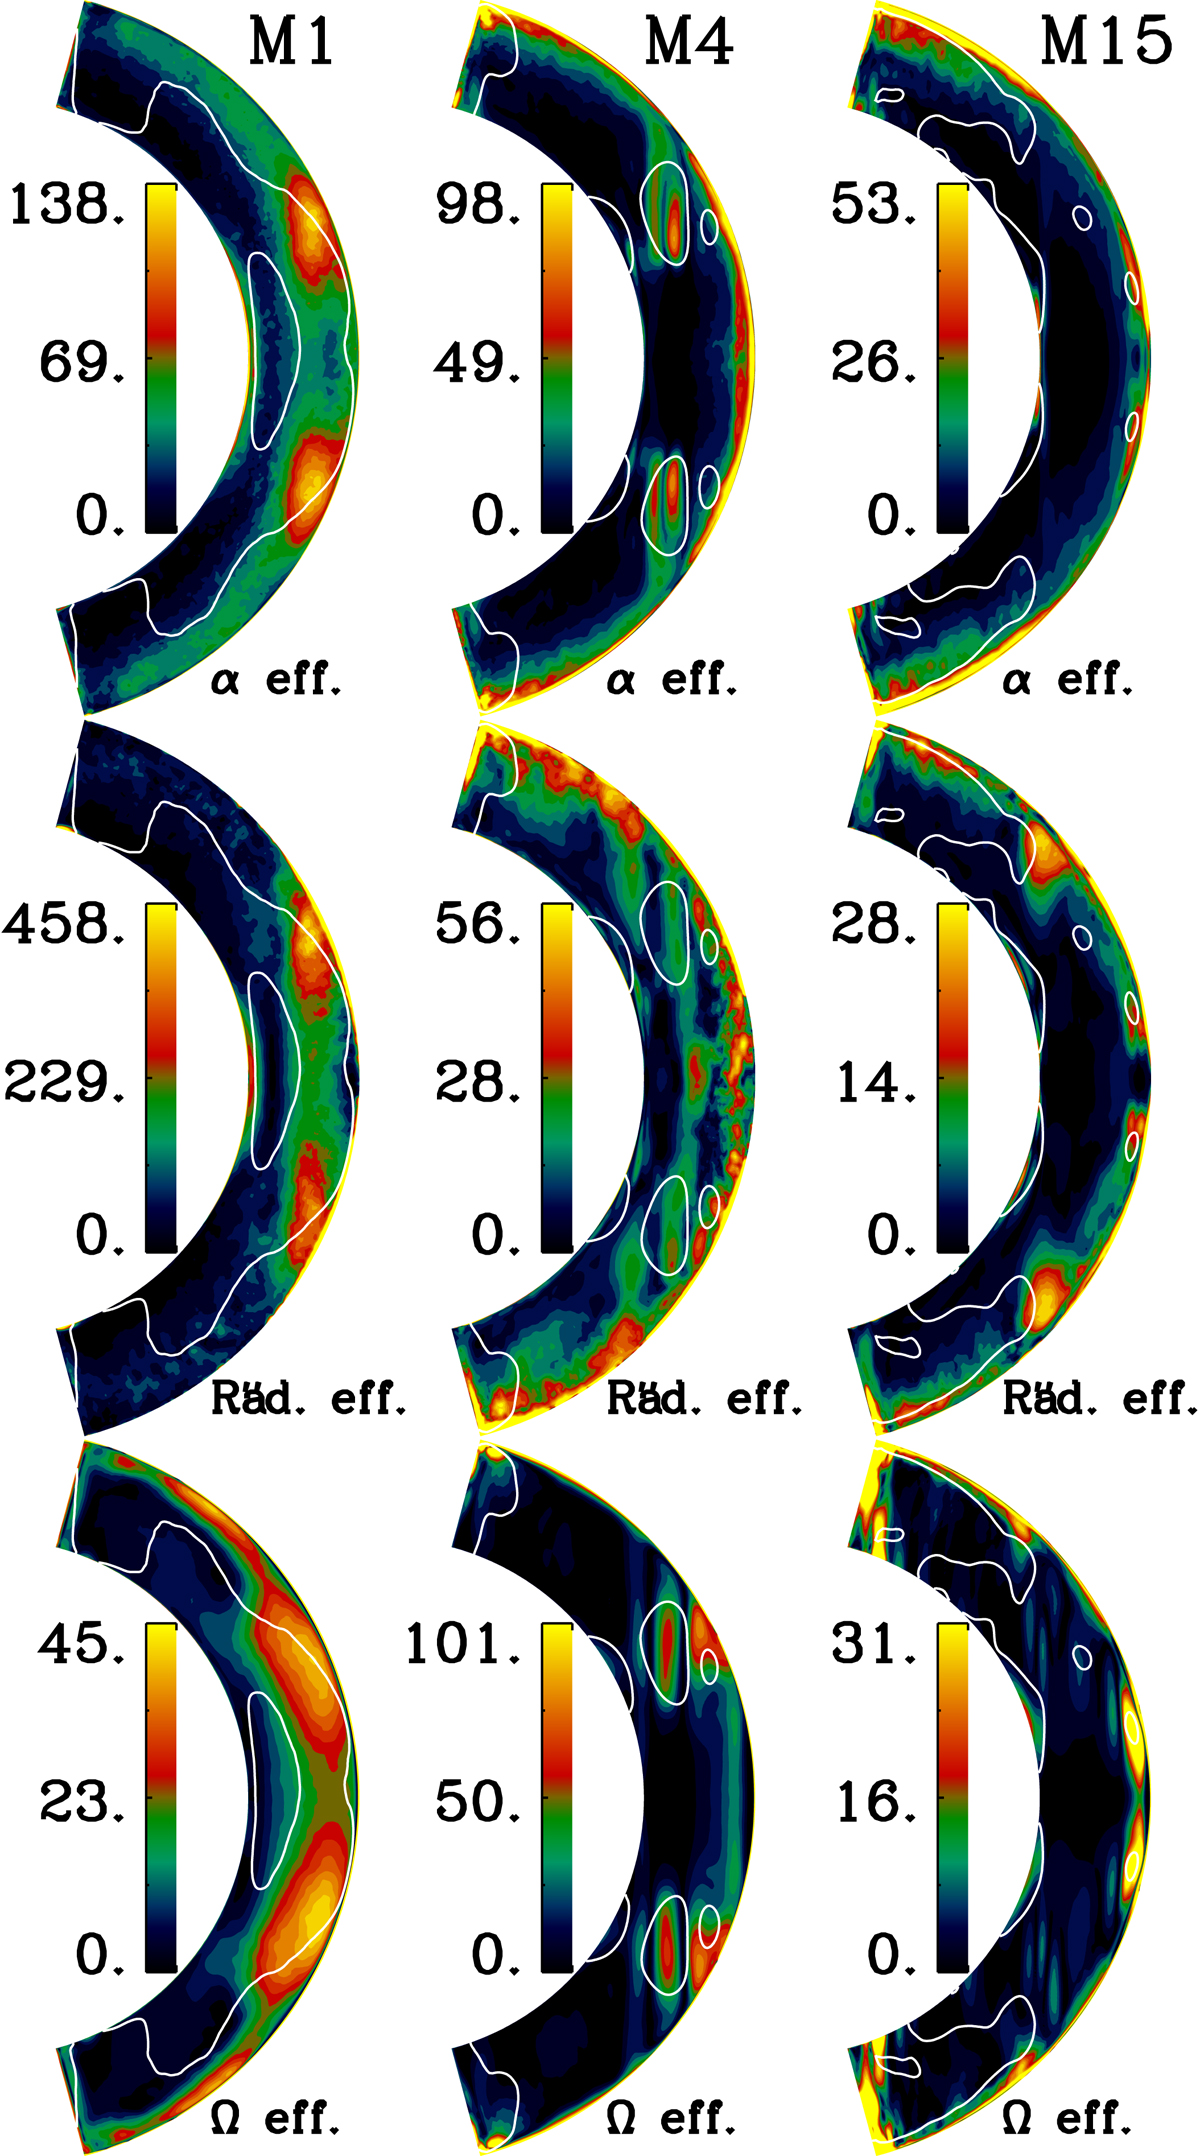
Dynamo effects generating ![]() for Runs M1, M4, and M15. We show the α effect (top row), the Rädler/δ effect (middle), and the Ω effect (bottom), where we overplot as white contours the rms values of
for Runs M1, M4, and M15. We show the α effect (top row), the Rädler/δ effect (middle), and the Ω effect (bottom), where we overplot as white contours the rms values of ![]() above half of the maximum, indicating the magnetic field region used in the calculation of the dynamo effects shown in Fig. 13. All values are given in kG yr−1.
above half of the maximum, indicating the magnetic field region used in the calculation of the dynamo effects shown in Fig. 13. All values are given in kG yr−1.
Current usage metrics show cumulative count of Article Views (full-text article views including HTML views, PDF and ePub downloads, according to the available data) and Abstracts Views on Vision4Press platform.
Data correspond to usage on the plateform after 2015. The current usage metrics is available 48-96 hours after online publication and is updated daily on week days.
Initial download of the metrics may take a while.