Fig. 10.
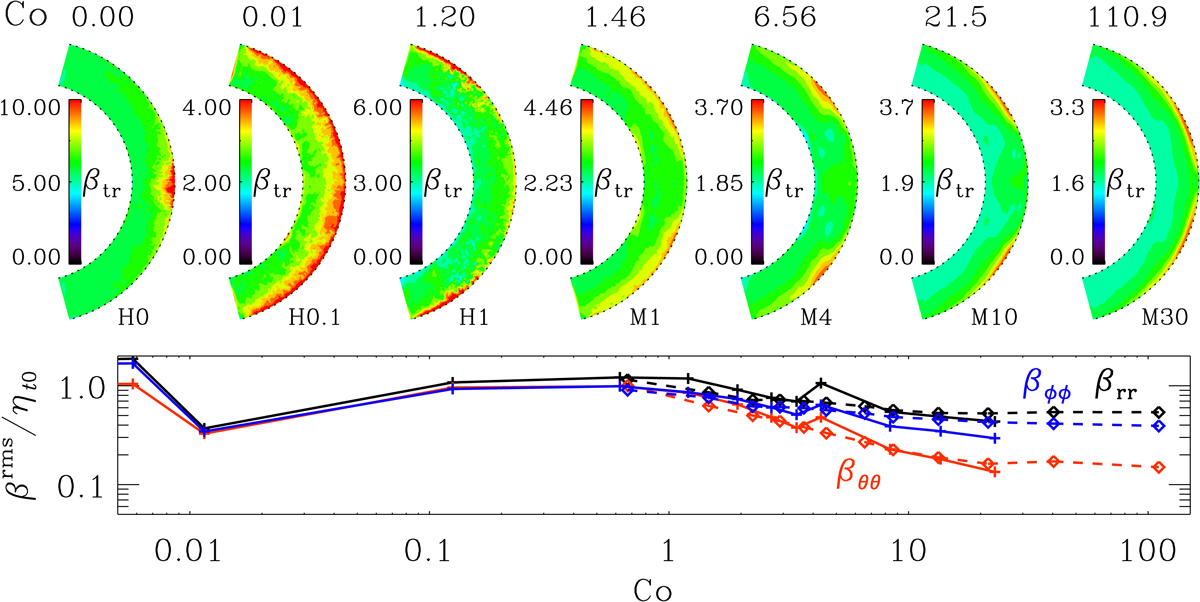
Rotational dependency of the turbulent diffusion as the trace of β. We show meridional profiles of βtr (top row) and the rms values of the diagonal component (bottom row), with βrr (black lines), βθθ (red), and βϕϕ (blue). As in Fig. 3, the values of the HD runs (Set H) are shown with a solid line and crosses, whereas the MHD runs (Set M) are shown with a dashed line with diamonds. All values are normalized by ![]() . The zero rotation run has been moved to Co = 10−4 to be visible in the lower panel.
. The zero rotation run has been moved to Co = 10−4 to be visible in the lower panel.
Current usage metrics show cumulative count of Article Views (full-text article views including HTML views, PDF and ePub downloads, according to the available data) and Abstracts Views on Vision4Press platform.
Data correspond to usage on the plateform after 2015. The current usage metrics is available 48-96 hours after online publication and is updated daily on week days.
Initial download of the metrics may take a while.