Fig. 9.
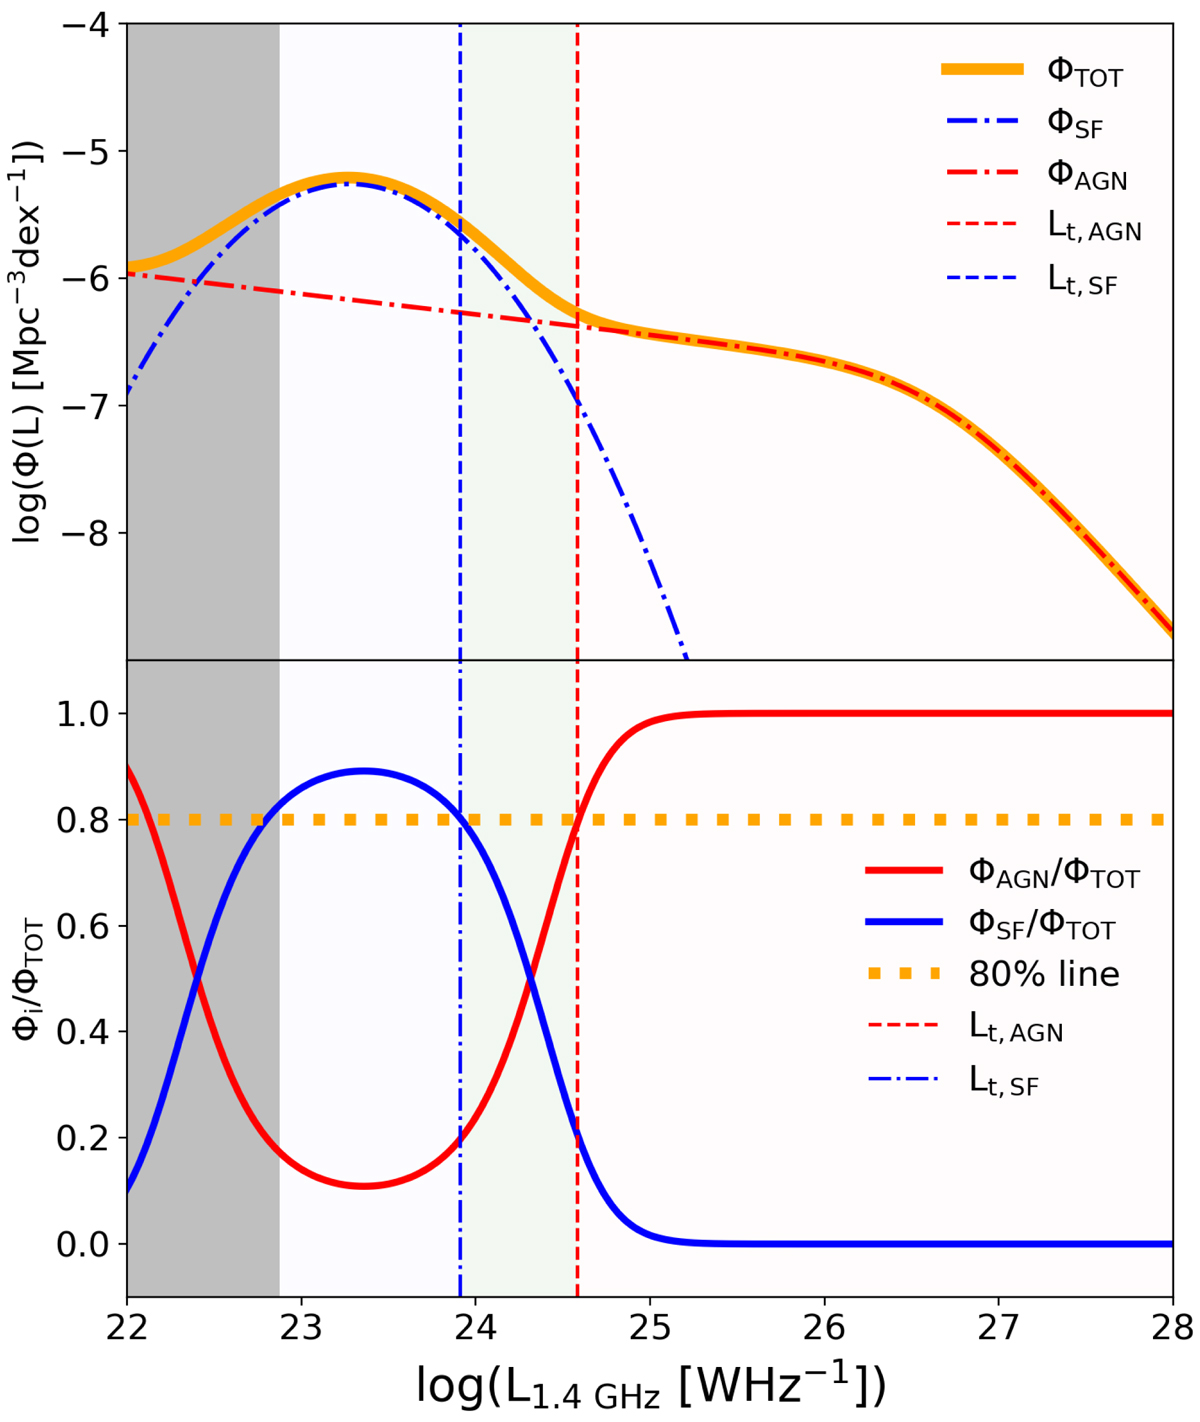
Example of how luminosity thresholds Lt, SF and Lt, AGN (blue and red dashed lines, respectively) were defined. Top: radio luminosity function (ΦTOT; orange line), constrained by the data at 2.23 < z < 2.69, is separated into a lower-luminosity “bump” (ΦSF; dot-dashed blue line) and the higher-luminosity double power-law (ΦAGN; dot-dashed red line). Bottom: ratios of the SF (ΦSF) and AGN (ΦAGN) contributions to the total RLF (ΦTOT) as a function of L1.4 GHz are shown by blue and red lines, respectively. Lt, SF and Lt, AGN are values of L1.4 GHz below and above which more than 80% of sources used to constrain the RLF are dominated by star formation and AGN-related radio emission, respectively. In both panels, the gray area shows the region of the plot in which the curves are just an extrapolation of the analytic forms of RLFs below the detection limits of radio data used to constrain them.
Current usage metrics show cumulative count of Article Views (full-text article views including HTML views, PDF and ePub downloads, according to the available data) and Abstracts Views on Vision4Press platform.
Data correspond to usage on the plateform after 2015. The current usage metrics is available 48-96 hours after online publication and is updated daily on week days.
Initial download of the metrics may take a while.