Fig. 8.
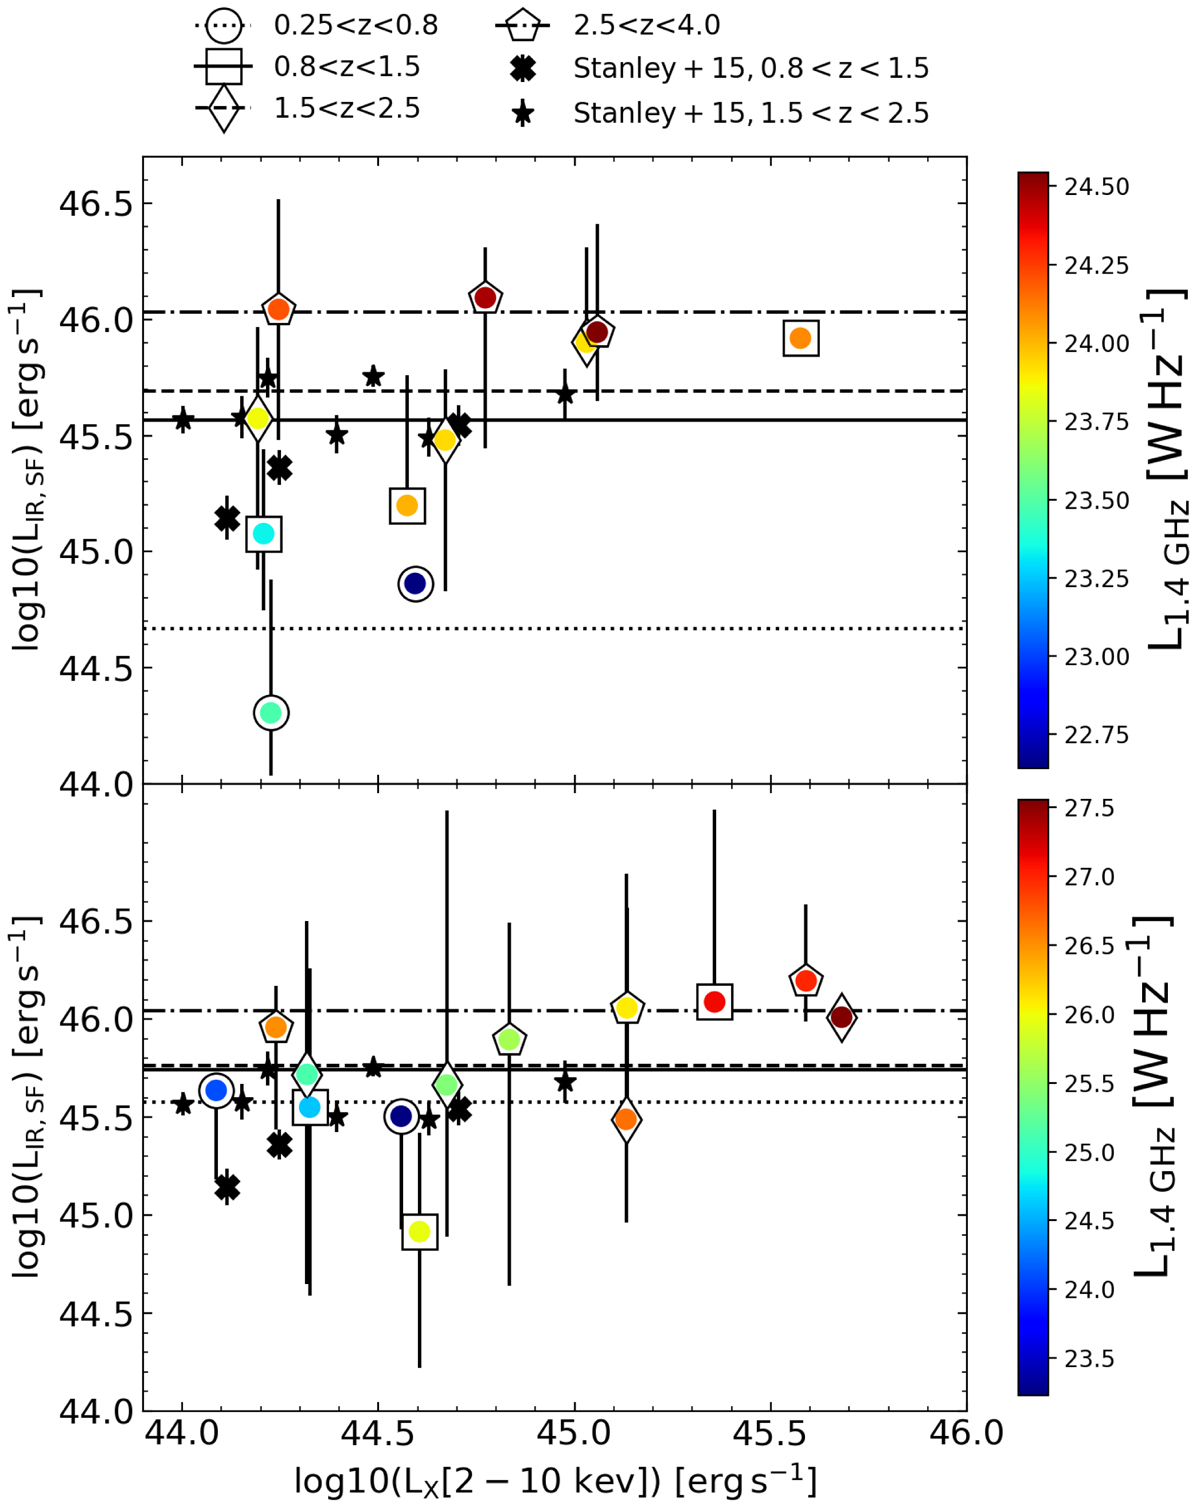
LIR, SF vs. LX[2−10 keV] of the XQSOs separated in four redshift bins, color-coded by their median 1.4 GHz radio luminosity. The upper and lower panels show XQSOs from the COSMOS and XXL-S fields, respectively. Lines show the mean value of LIR, SF in different redshift bins, as indicated in legend. We note that the two color-coded bars correspond to very different ranges in L1.4 GHz in COSMOS and XXL-S.
Current usage metrics show cumulative count of Article Views (full-text article views including HTML views, PDF and ePub downloads, according to the available data) and Abstracts Views on Vision4Press platform.
Data correspond to usage on the plateform after 2015. The current usage metrics is available 48-96 hours after online publication and is updated daily on week days.
Initial download of the metrics may take a while.