Fig. 6.
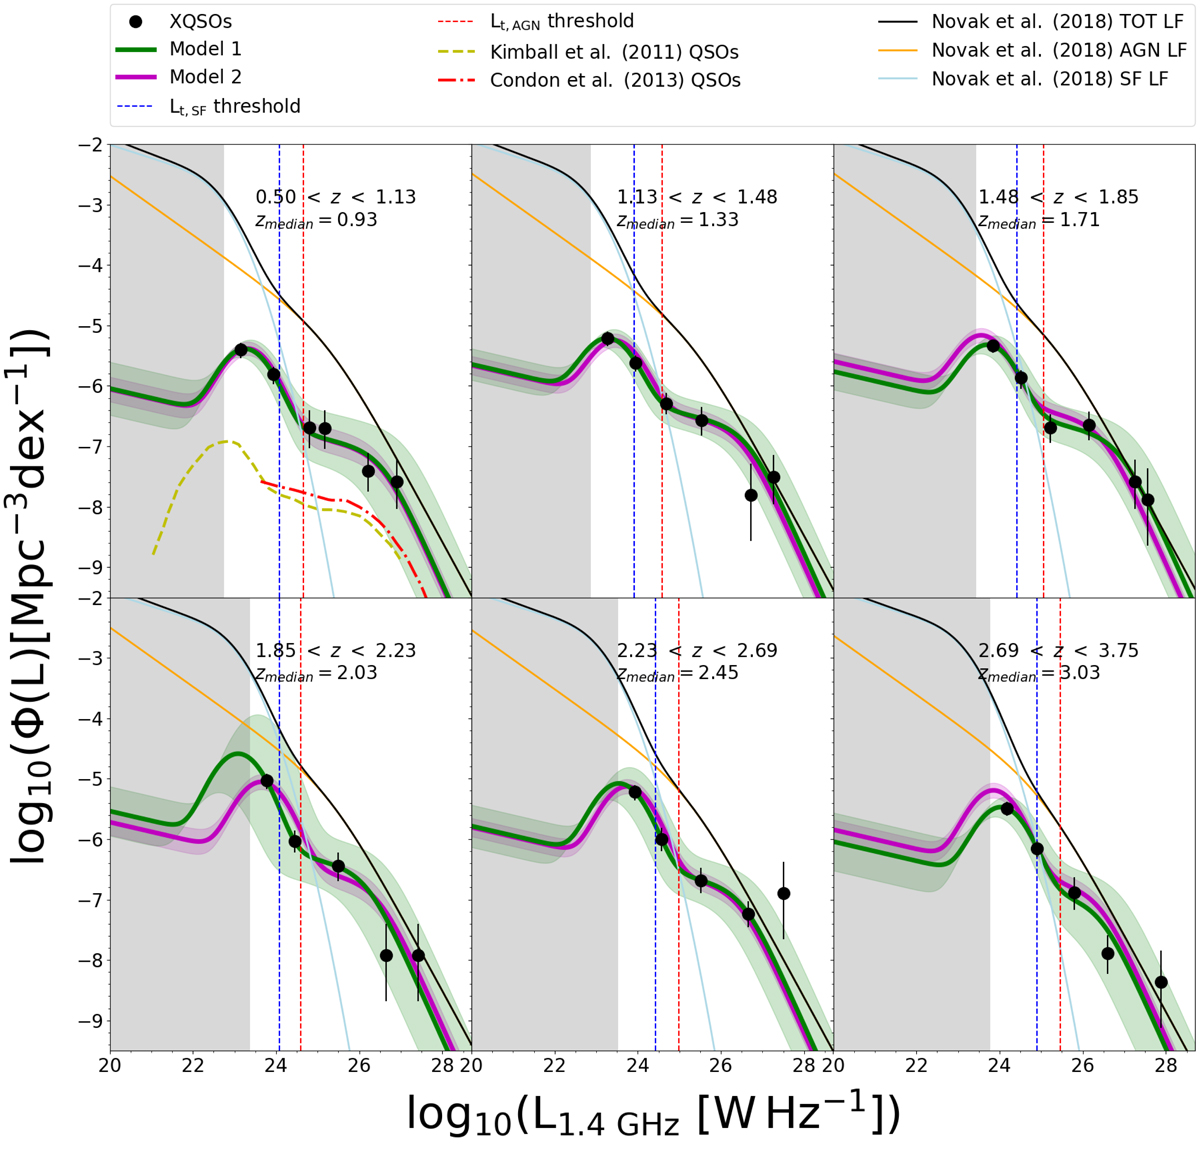
Radio luminosity function at 1.4 GHz of the radio and X-ray selected quasars at redshifts 0.50 < z < 3.75. Solid green and magenta lines show the results of testing Model 1 and Model 2, respectively, with shaded areas showing 1σ confidence range. Thin solid light blue, orange, and black lines show the SFG, AGN and the total (SFG and AGN) RLFs by Novak et al. (2018). Thin blue and red vertical dashed lines show the threshold luminosities below and above which more than 80% of sources contributing to the RLF are dominated by SF and AGN-related processes, respectively. The gray shaded area shows the region unconstrained by our data where the RLF is just an extrapolation. Our results imply that the radio emission in a majority of lower radio luminosity XQSOs is powered by star formation.
Current usage metrics show cumulative count of Article Views (full-text article views including HTML views, PDF and ePub downloads, according to the available data) and Abstracts Views on Vision4Press platform.
Data correspond to usage on the plateform after 2015. The current usage metrics is available 48-96 hours after online publication and is updated daily on week days.
Initial download of the metrics may take a while.