Fig. 11.
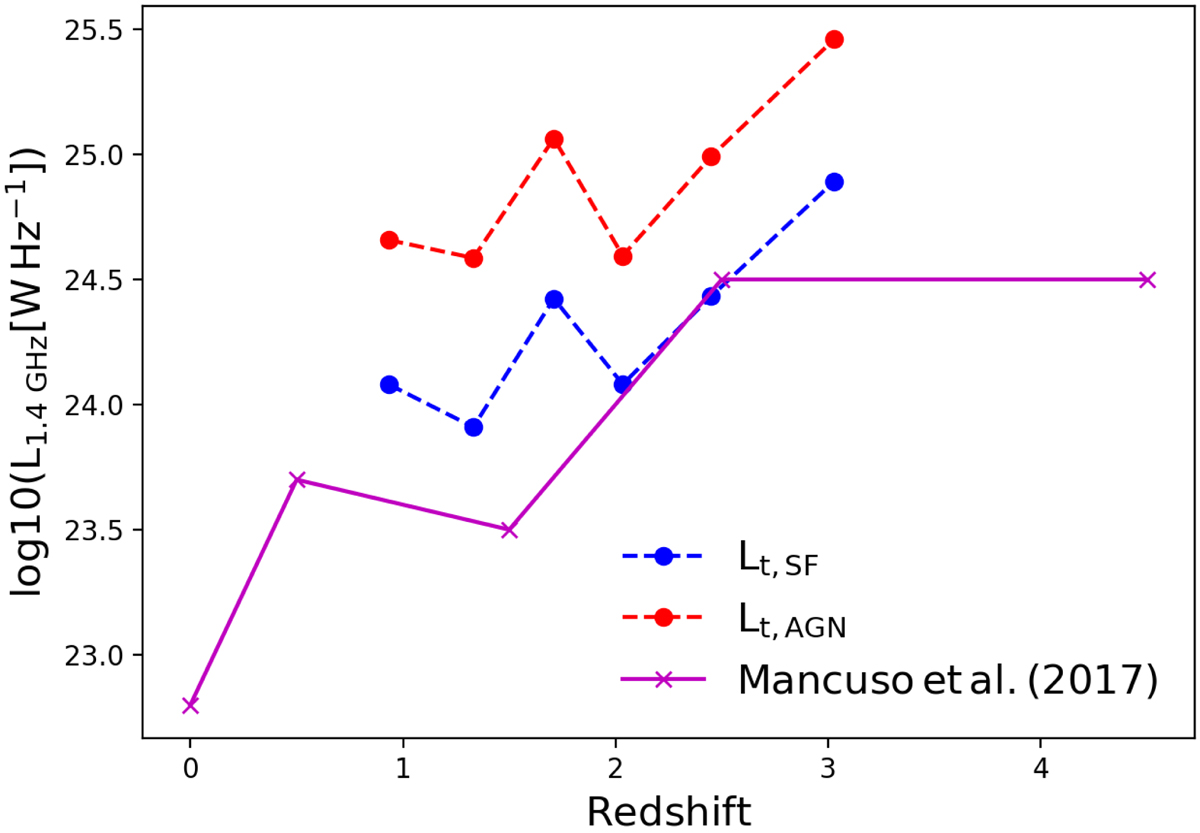
1.4 GHz radio luminosity thresholds vs. redshift. Blue and red dots and dotted lines show the redshift evolution of thresholds below and above more than 80% of sources contributing to the XQSO RLF are dominated by star formation and AGN activity, respectively. Magenta symbols and line are taken from Mancuso et al. (2017) and represent the threshold at which SFGs and RQ AGN change dominance in their RLFs.
Current usage metrics show cumulative count of Article Views (full-text article views including HTML views, PDF and ePub downloads, according to the available data) and Abstracts Views on Vision4Press platform.
Data correspond to usage on the plateform after 2015. The current usage metrics is available 48-96 hours after online publication and is updated daily on week days.
Initial download of the metrics may take a while.