Fig. 10.
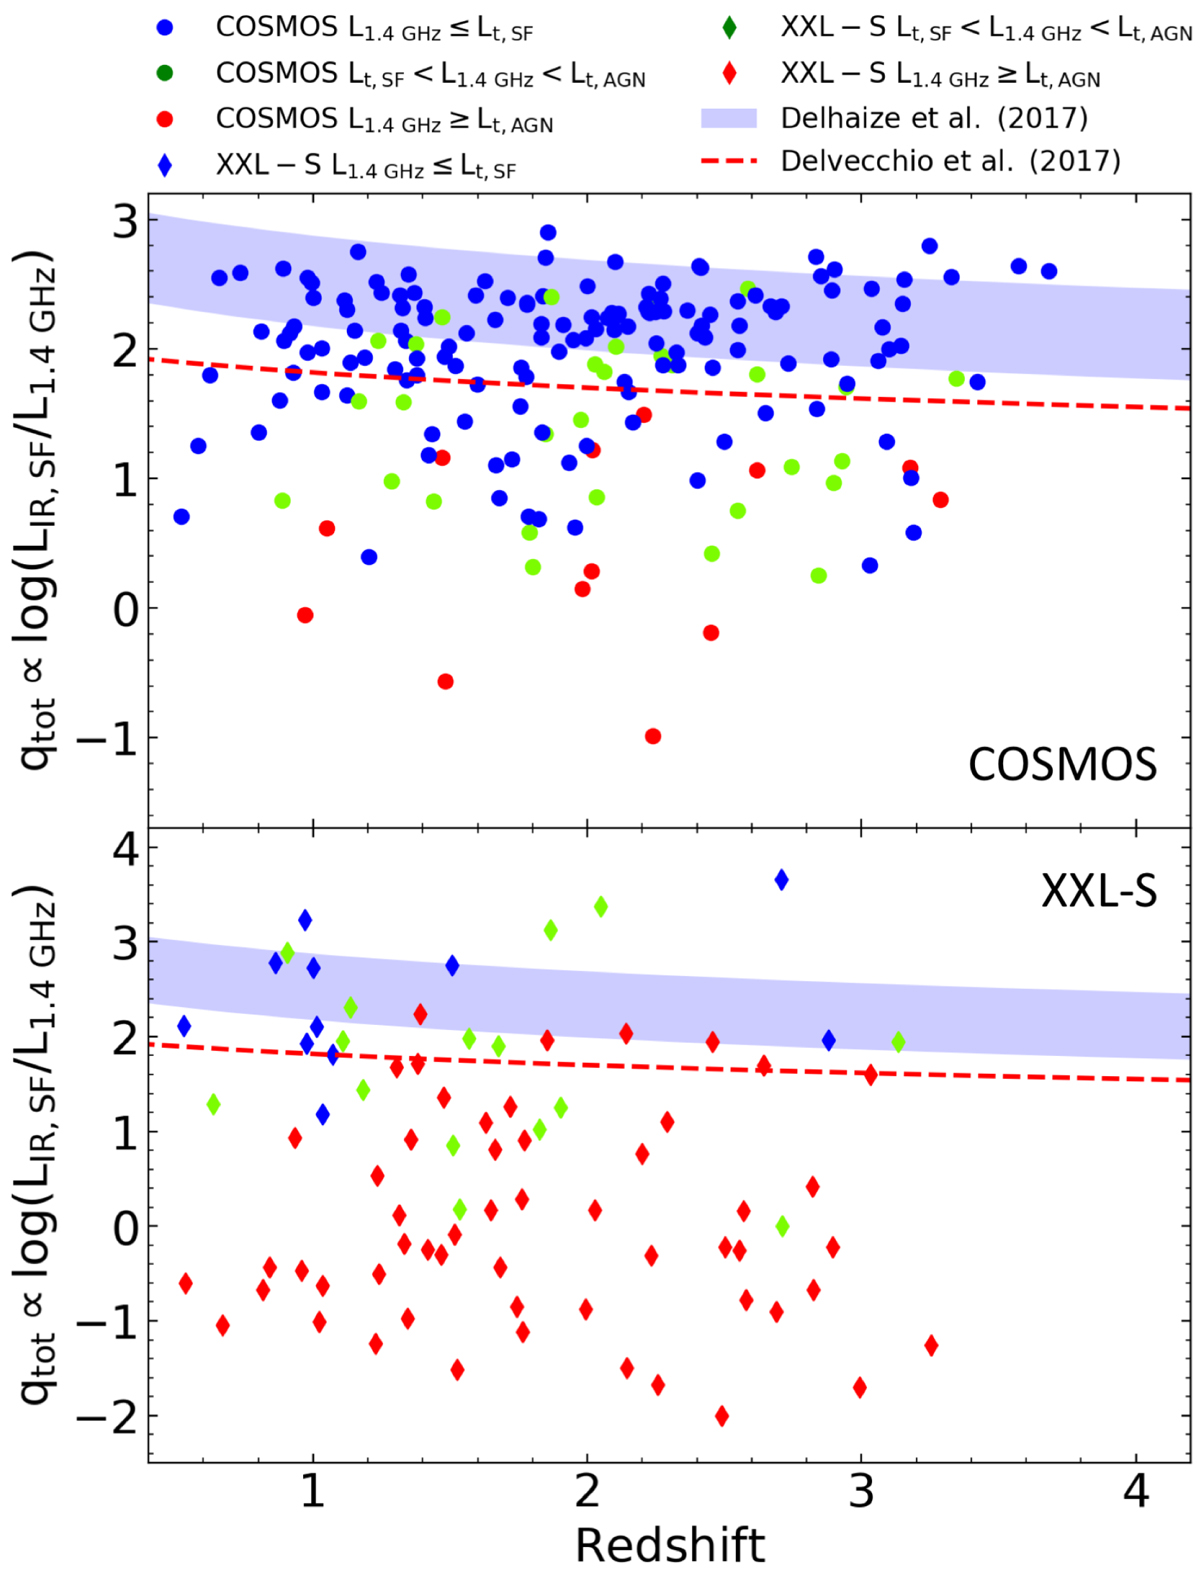
qTOT vs. redshift of COSMOS (upper panel) and XXL-S (lower panel) XQSOs. Sources with L1.4 GHz ≤ Lt, SF, Lt, SF < L1.4 GHz < Lt, AGN and L1.4 GHz ≥ Lt, AGN are shown with blue, green and red symbols respectively. The red dashed line shows the radio-excess threshold defined by Delvecchio et al. (2017). The blue shaded area shows the “SFG locus” by Delhaize et al. (2017).
Current usage metrics show cumulative count of Article Views (full-text article views including HTML views, PDF and ePub downloads, according to the available data) and Abstracts Views on Vision4Press platform.
Data correspond to usage on the plateform after 2015. The current usage metrics is available 48-96 hours after online publication and is updated daily on week days.
Initial download of the metrics may take a while.