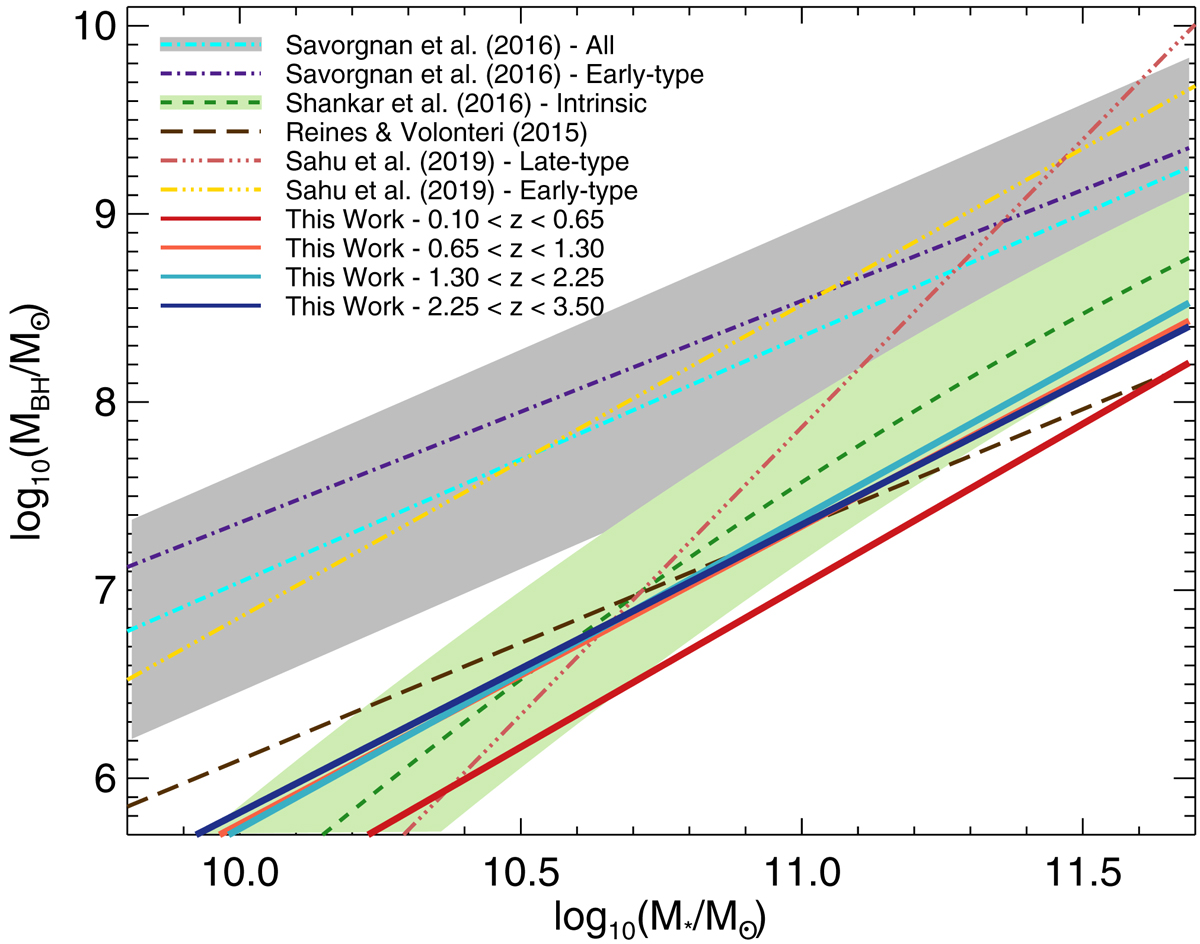
Fig. 6.

Comparison between our M* and MBH from Eq. (9) and parameters α and β from Table 3 for star-forming galaxies and results from models in the literature. Data from this work are shown as solid lines and are color-coded according to redshift as in Figs. 3 and 4. The relations from Savorgnan & Graham (2016) use the M* of the bulge. The gray shaded area is the confidence range for Savorgnan & Graham (2016), and the light green are is the confidence range for Shankar et al. (2016).
Current usage metrics show cumulative count of Article Views (full-text article views including HTML views, PDF and ePub downloads, according to the available data) and Abstracts Views on Vision4Press platform.
Data correspond to usage on the plateform after 2015. The current usage metrics is available 48-96 hours after online publication and is updated daily on week days.
Initial download of the metrics may take a while.


