Fig. 3.
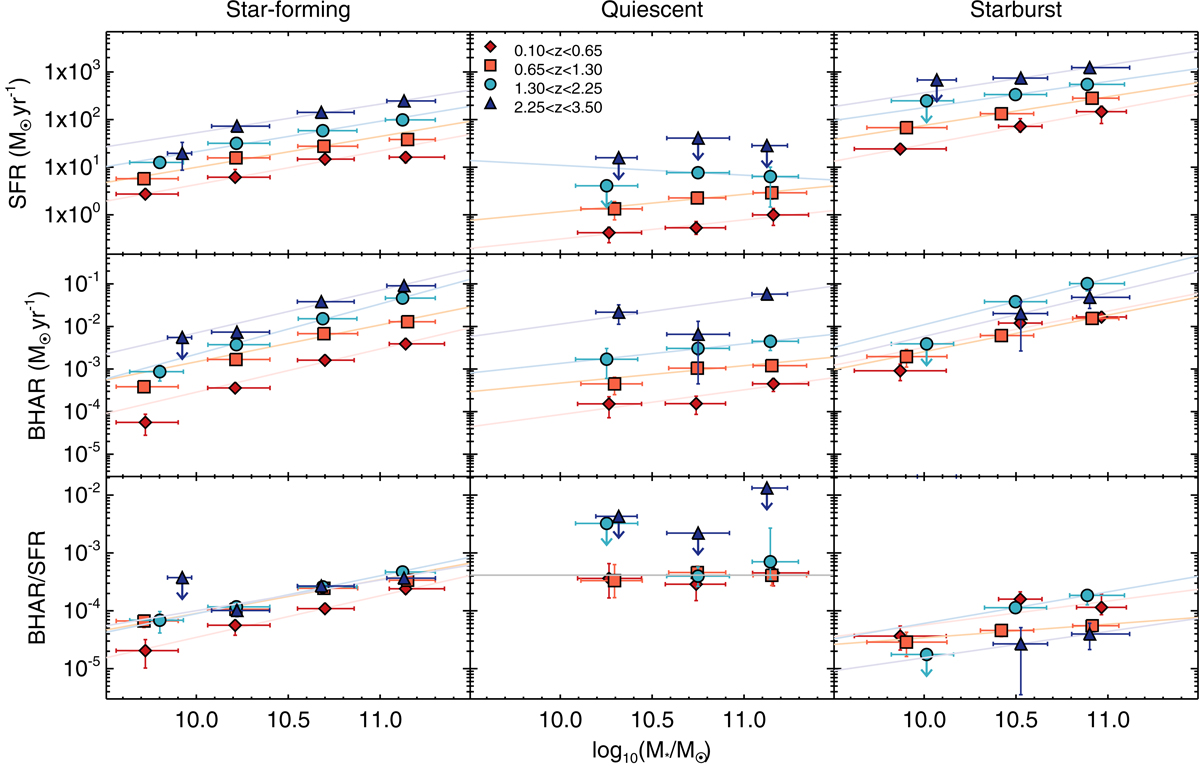
Comparison between the average SFR and the average BHAR for the three samples: normal star-forming galaxies (left), quiescent galaxies (center), and starburst galaxies (right). In all plots data points are color- and shape-coded according to the redshift interval. The data points are the median value, and vertical errors represent the 5th and 95th percentile. We show an upper limit (the 95th percentile) for the data points whose SFR or BHAR 5th percentile is compatible with zero and for starburst galaxies at high redshift and low mass, where our sample is inclomplete in mass. The error bars shown on the stellar masses correspond to 1σ of the distribution. The solid light colored lines are the best fits and are color-coded according to each redshift bin (see Table 3). Top panel: M*-SFR relation. Middle panel: M*-BHAR relation. Bottom panel: BHAR-to-SFR ratio as a function of stellar mass. The dotted gray line for quiescent galaxies is at a constant value of BHAR/SFR = 3.8 × 10⁻⁴.
Current usage metrics show cumulative count of Article Views (full-text article views including HTML views, PDF and ePub downloads, according to the available data) and Abstracts Views on Vision4Press platform.
Data correspond to usage on the plateform after 2015. The current usage metrics is available 48-96 hours after online publication and is updated daily on week days.
Initial download of the metrics may take a while.