Fig. 2.
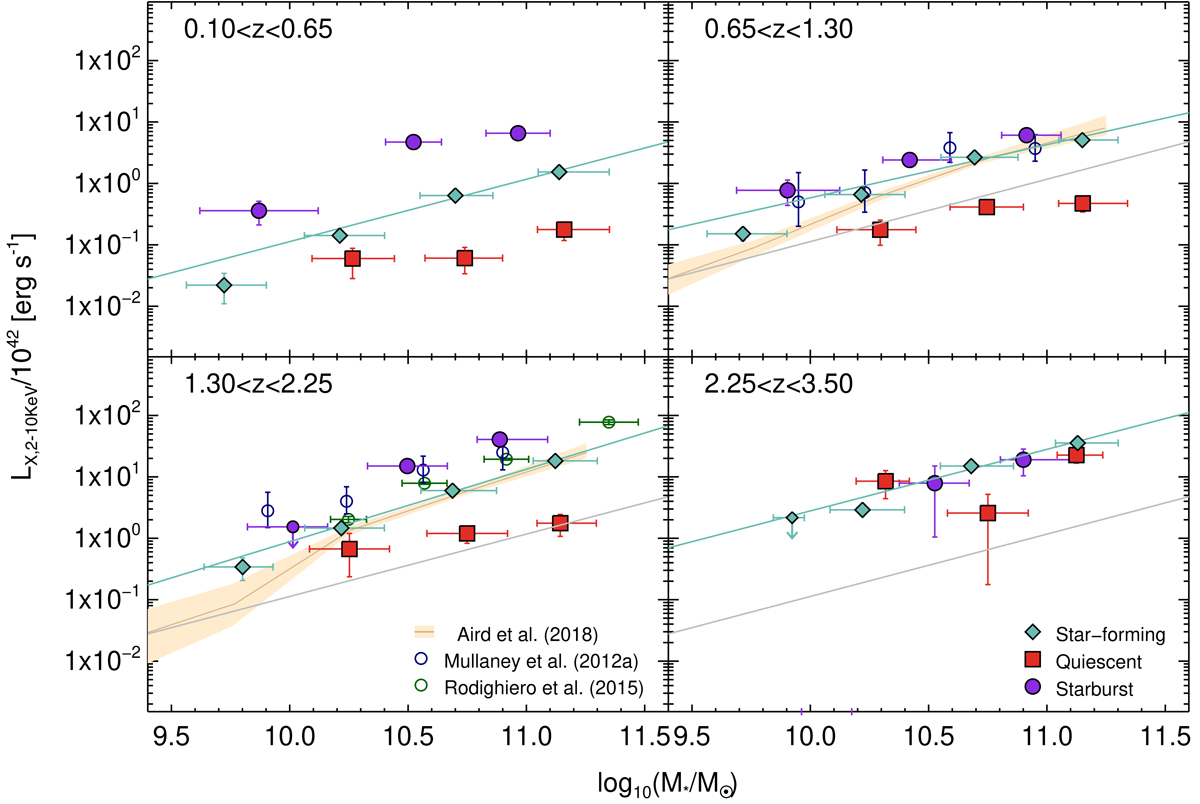
X-ray luminosity in the 2–10 keV band for our sample as a function of stellar mass. Each panel represents one of the four redshift bins that we considered. The light green diamonds represent the normal star-forming sample, the red squares represent the quiescent sample, and the violet circles represent the starburst sample. The data points represent the median value of the stellar mass and the X-ray luminosity. Vertical error bars represent the 5th and 95th percentile (90% confidence interval) of the distributions, while horizontal error bars correspond to 1σ. We show an upper limit (the 95th percentile) for the data points whose X-ray luminosity 5th percentile is compatible with zero and for starburst galaxies at high redshift and low mass, where our sample is incomplete. The light green continuous line is the best fit for the star-forming galaxy data points at each redshift, while the gray line shows the best fit in the lowest redshift bin, shown for comparison purposes. We also report data points from Mullaney et al. (2012b) at an average redshift of z = 1, 2 (open dark blue circles, Rodighiero et al. 2015) at an average redshift of z = 2 (open green circles) and Aird et al. (2018) at z = 1, 2 (solid brown curve; the yellow area shows the 1σ confidence interval). The data points from Rodighiero et al. (2015) and Aird et al. (2018) are scaled to the same k-correction as we adopted here.
Current usage metrics show cumulative count of Article Views (full-text article views including HTML views, PDF and ePub downloads, according to the available data) and Abstracts Views on Vision4Press platform.
Data correspond to usage on the plateform after 2015. The current usage metrics is available 48-96 hours after online publication and is updated daily on week days.
Initial download of the metrics may take a while.