Fig. 22.
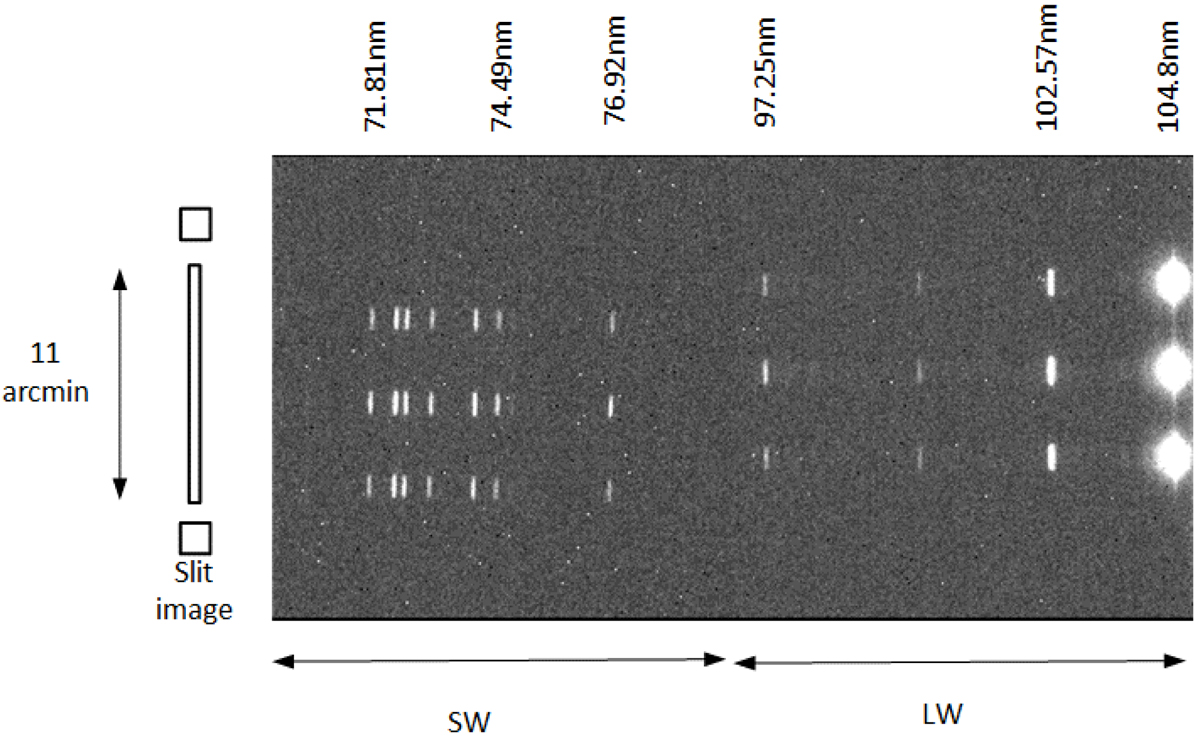
Composite SPICE spectral image (argon spectrum), of the three beam positions used. On the left, the slit image is displayed on the same scale. The identification of the hollow-cathode-source argon lines wavelengths is derived from the literature. It should be noted that the slit images appear at different row positions on the SW and LW detectors.
Current usage metrics show cumulative count of Article Views (full-text article views including HTML views, PDF and ePub downloads, according to the available data) and Abstracts Views on Vision4Press platform.
Data correspond to usage on the plateform after 2015. The current usage metrics is available 48-96 hours after online publication and is updated daily on week days.
Initial download of the metrics may take a while.