Free Access
Fig. 20.
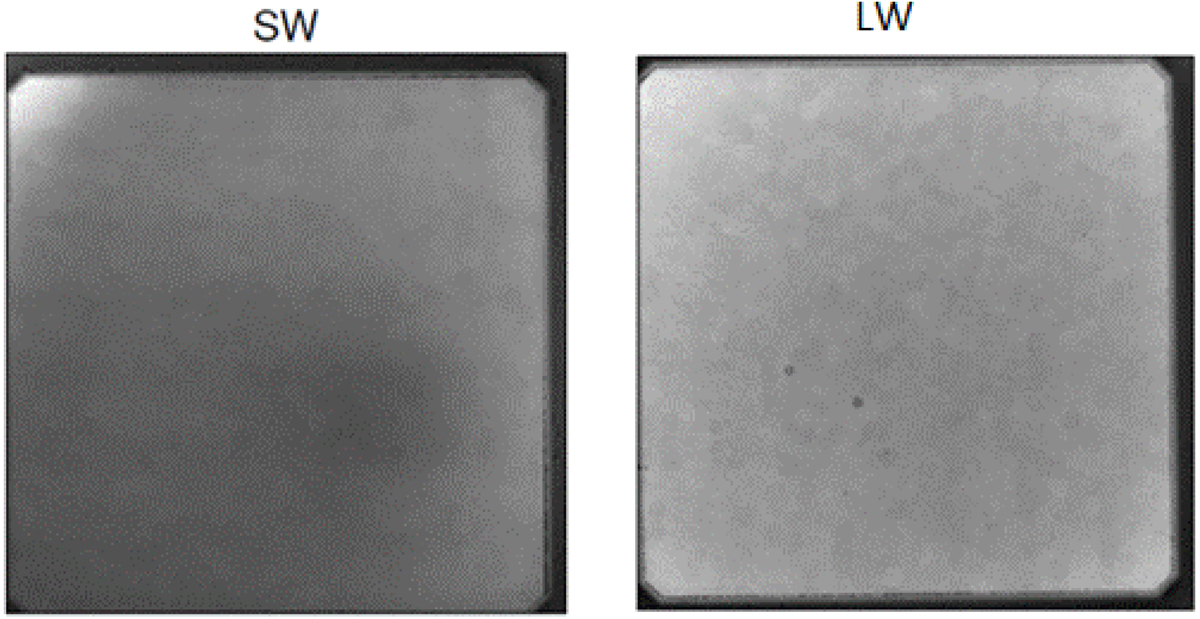
Flat-field (relative responsivity across the arrays, shown in grey-scale), for SW and LW detectors, in the APS image (1024 × 1024 pixels), measured at 123 nm. The dark borders occur because the detector fibre-optic coupler does not fully fill the APS.
Current usage metrics show cumulative count of Article Views (full-text article views including HTML views, PDF and ePub downloads, according to the available data) and Abstracts Views on Vision4Press platform.
Data correspond to usage on the plateform after 2015. The current usage metrics is available 48-96 hours after online publication and is updated daily on week days.
Initial download of the metrics may take a while.